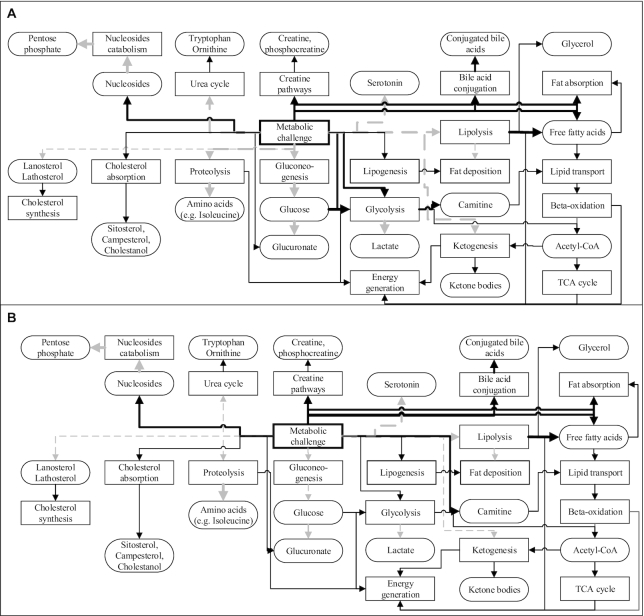
FIGURE 2.
The potentially altered metabolic pathways and respective metabolites by energy-based metabolic challenge both in normal (A) and insulin-resistant (B) individuals, as suggested by the current literature. Solid black lines/arrows indicate stimulation; dashed gray lines/arrows indicate inhibition. Thick lines indicate stronger stimulation or inhibition.

