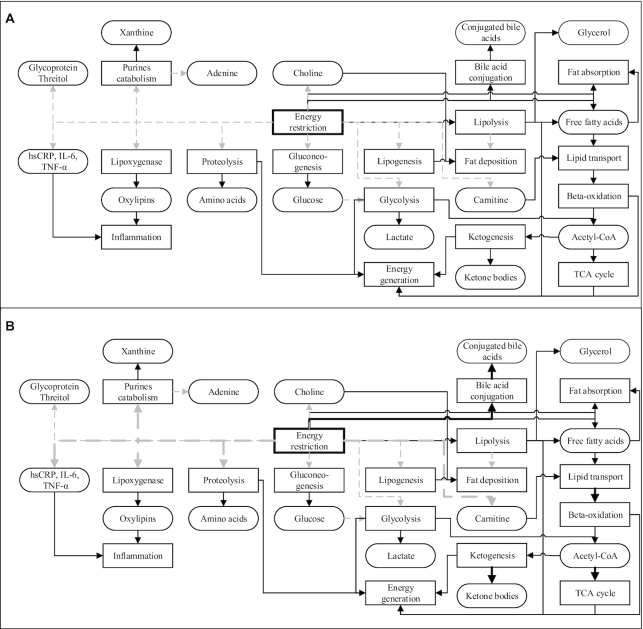
FIGURE 3.
The potentially altered metabolic pathways and respective metabolites by energy restriction both in normal individuals (A) and those with metabolic syndrome (B), as suggested by the current literature. Solid black lines/arrows indicate stimulation; dashed gray lines/arrows indicate inhibition. Thick lines indicate stronger stimulation or inhibition. hsCRP, high-sensitivity C-reactive protein; TCA cycle, tricarboxylic acid/Krebs cycle.

