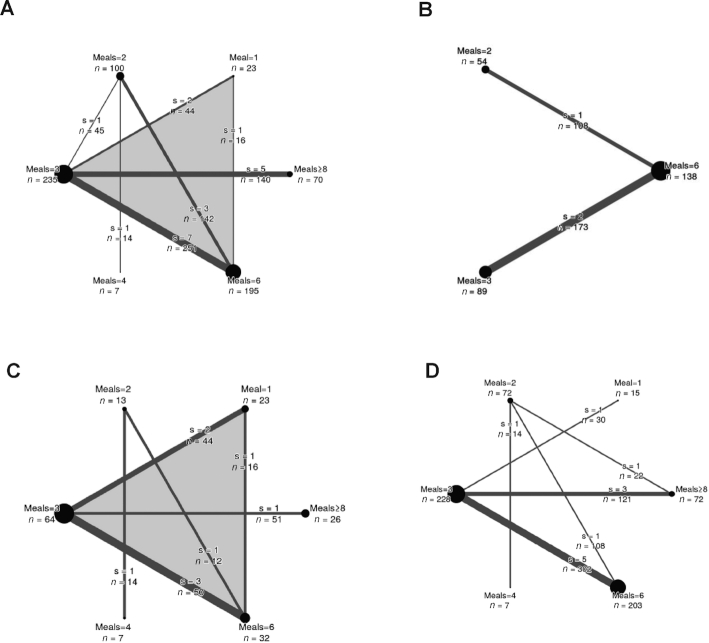
FIGURE 2.
Network diagrams for body weight (A), waist circumference (B), fat mass (C), and energy intake (D). The size of the nodes is proportional to the total number of participants allocated to the intervention and the thickness of the lines proportional to the number of studies evaluating each direct comparison. Moreover, the total number of participants for each comparison is displayed (e.g., the body-weight comparison of 3 meals/d and 6 meals/d included 7 studies with a total of 251 participants). The number of multiarm studies for the interventions are indicated by the shade of gray of the background (white for none). s, studies.

