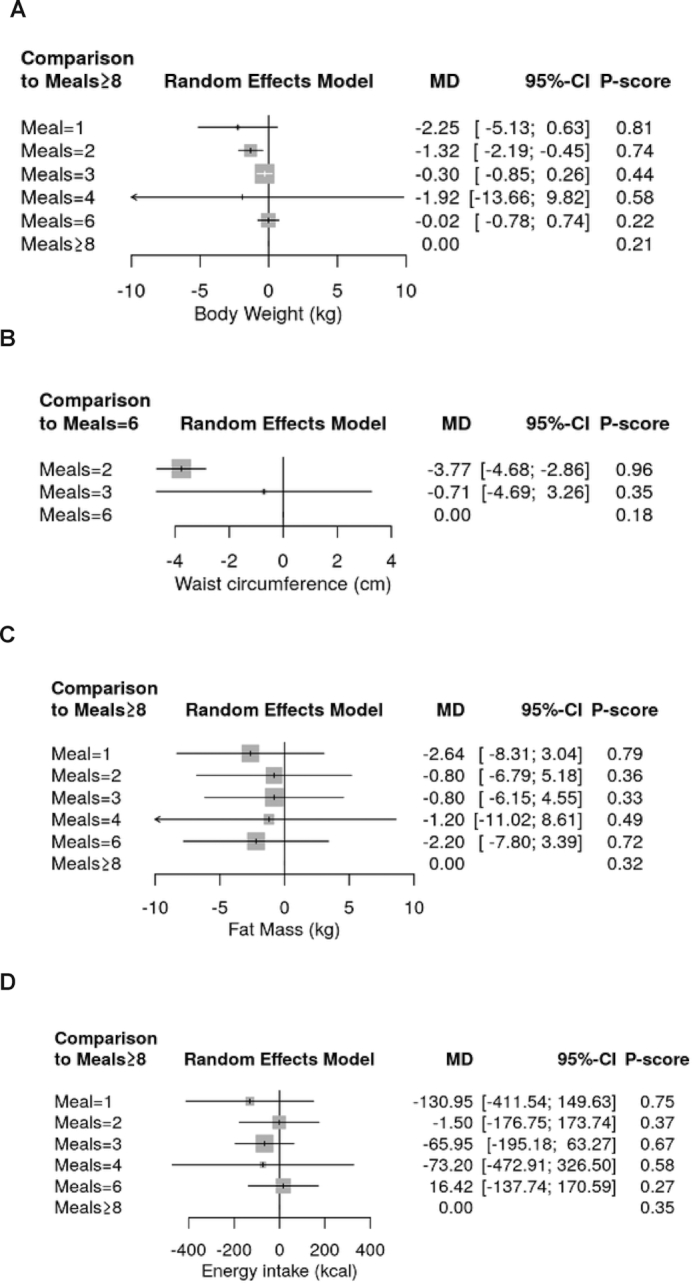
FIGURE 3.

Summary effect estimates of different dietary approaches on body weight (A), waist circumference (B), fat mass (C), and energy intake (D). “≥8” Meals (if available) is defined as the reference treatment. P-scores are defined, such that they are between 0 and 1, where 0 means that a treatment is always worst and 1 means that a treatment is always best compared with the other treatments in the network. For example, 2 meals/d (P-score: 0.96) was ranked best to improve waist circumference, followed by 3 meals/d (0.35), and 6 meals/d (0.18). MD, mean difference.
