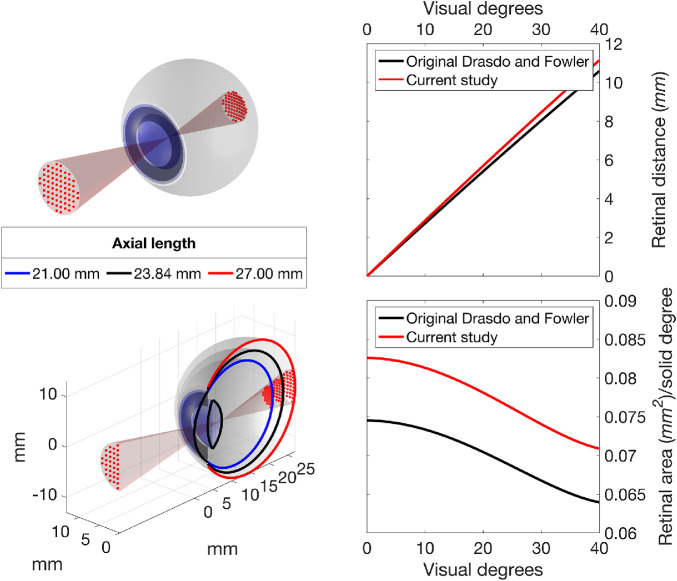
Figure 1.
Rendering of the schematic eye, with a projection of a 10-2 grid (red dots, top panel). The bottom panel shows a cross-section of the same schematic eye with additional examples of short and long axial lengths. Right panels show the distance travelled on the retina per visual degree (top) and the mm2/solid degree ratio at various retinal eccentricities (bottom). The latter represents the ratio between retinal areas in mm2 to visual degrees2. The curved relationship with eccentricity is a consequence of the nonlinear projection obtained by numerical calculations of ray tracing through the cornea, lens and vitreous, which varies with visual angle. It is important to acknowledge that the relationship between retinal mm and degrees of visual angle is also not linear. In black, the curves obtained from the original schematic eye described by Drasdo and Fowler21 (in black). In red, the results of the schematic eye used in this study.

