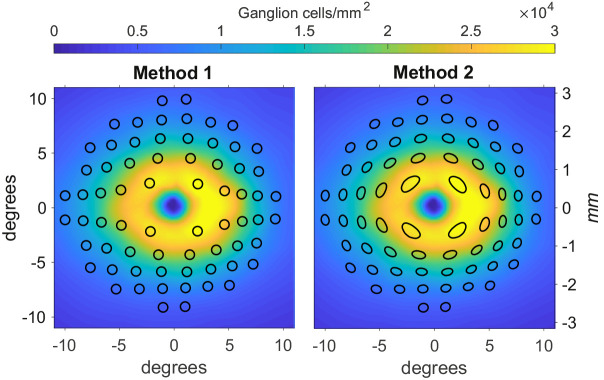
Figure 2.
Representations of the two candidate methods to apply the displacement to perimetric stimuli. Method 1 is the one applied by Yoshioka et al.13. Method 2 is the one proposed in this article. The color map represents the histology density at AL0 for both graphs. The vertical axes are reported both in mm and visual degrees. The black shapes represent the areas tested by a 10-2 perimetric test, displaced with the two methods. In both images we are displaying the results of the application of the two methods on Goldmann IV stimuli, assumed circular and arranged in a regular 10-2 grid.

