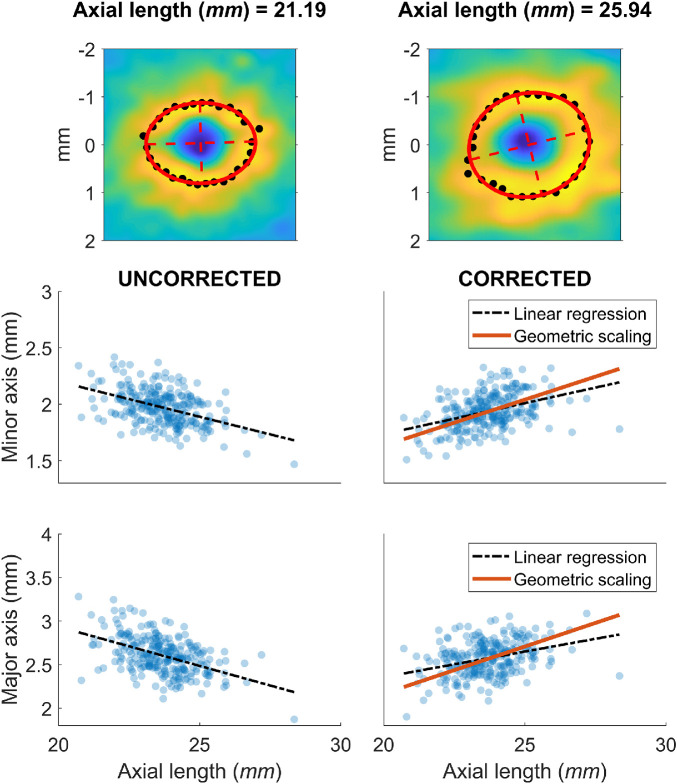
Figure 3.
Scaling of ocular structures with axial lengths. Top panels show two examples of the calculation for the descriptive ellipses (in red), as described in the Methods. The black points identify the peaks in the GCL profile used for the fitting. Lower panels show the measurements of the major and minor axis of the ellipses before (left) and after (right) correction for ocular magnification.

