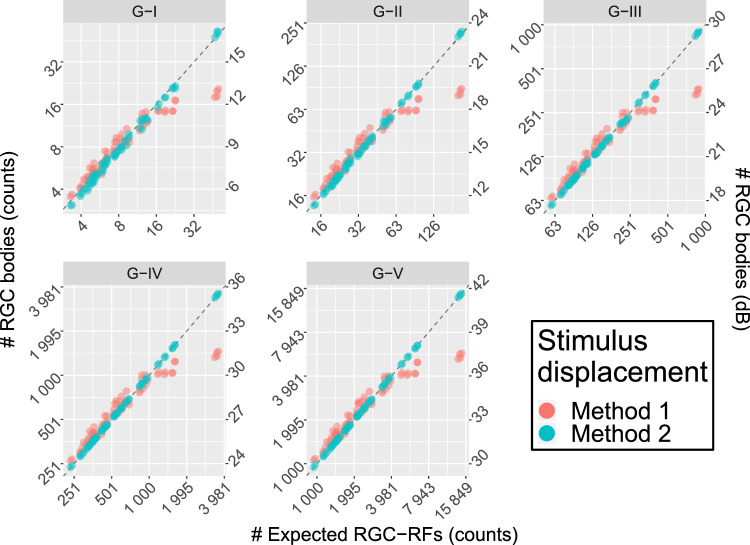
Figure 5.
Comparison of the results between the two displacement methods for perimetric stimuli. Method 1 is the one used by Yoshioka et al.13. Method 2 is the one proposed in this article. The horizontal axis reports the expected RGC-RF counts, calculated from the model proposed by Drasdo et al.,15 (Equation (3)) and do not represent real subject data. The vertical axis reports the structural measurements from the RGC map both as counts (left axis) and in dB (right axis). The latter is meant for easier comparison with the results in Yoshioka et al.13. Only Method 2 yields correct estimates in the parafoveal region (higher counts). The dashed line represents the ideal line of equivalence.

