Figure A1.

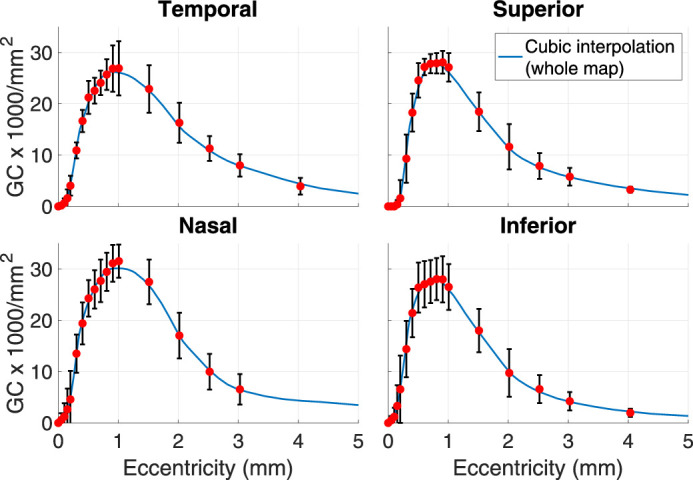
Comparison of the cubic interpolation from the whole spherical map and the raw averages (red dots) and standard deviations (black vertical bars) reported by Curcio and Allen.16

Comparison of the cubic interpolation from the whole spherical map and the raw averages (red dots) and standard deviations (black vertical bars) reported by Curcio and Allen.16