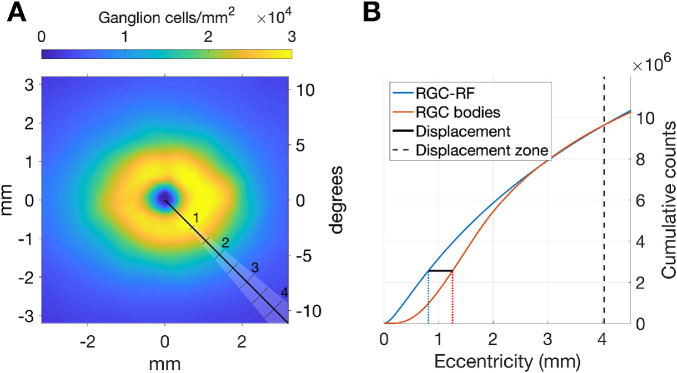
Figure A2.
Example of how the displacement is computed along a specific meridian. (A) The black line indicates the meridian analyzed. The shaded area highlights the radial sector. The ticks indicate the distance in mm. The color map represents the RGC histology density map. (B) The displacement is calculated as the distance (black solid line) between the two eccentricities at which the cumulative counts of RGC-RF (blue solid line) and the RGC bodies (red solid line) are equal. The dashed vertical line indicates the eccentricity of the maximum displacement zone. The fitting process requires that the two cumulative counts are the same at this eccentricity.

