Figure 3.

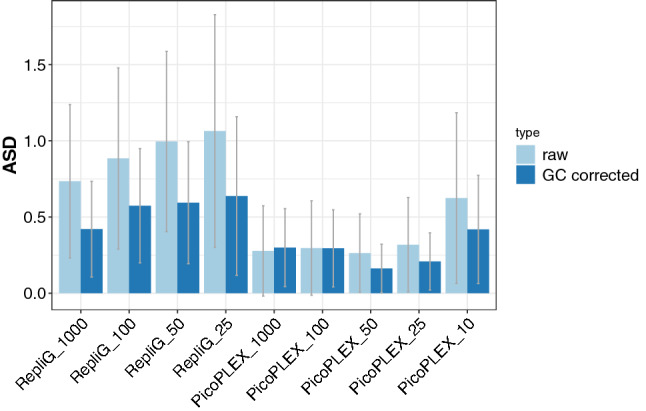
The average somy deviation (ASD) per chromosome between the BPK275 bulk control and the RepliG or the PicoPLEX samples, without (left bar) and with (right bar) GC bias correction. The error bars represent their standard deviation.

The average somy deviation (ASD) per chromosome between the BPK275 bulk control and the RepliG or the PicoPLEX samples, without (left bar) and with (right bar) GC bias correction. The error bars represent their standard deviation.