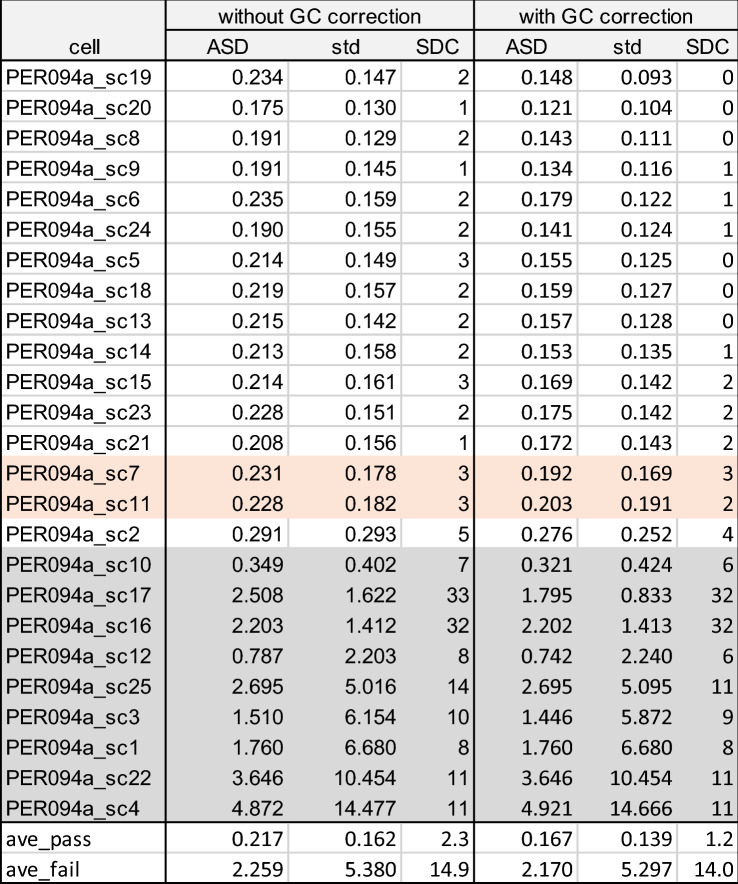
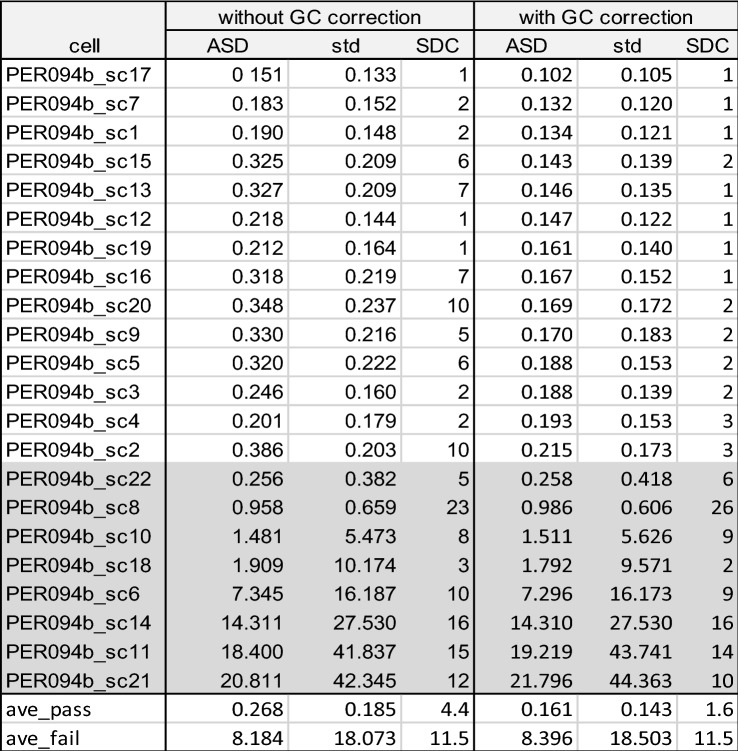
Table 2.
Estimation of somy deviation in PER094a and b single cell samples, without and with GC bias correction.
ASD and SDC between a single cell sample and BPK094 control and corresponding standard deviation (see Table 1 for explanation of ASD and SDC). The single cells with even depth are shown in white and the single cells with uneven depth are shown in gray. At the bottom of the table, average of high quality (even depth, ave_pass) and low quality (uneven depth, ave_fail) are indicated. Two intermediate depth quality samples PER094a_sc7 and PER094a_sc11 (indicated in orange) were not included in the summary statistics.


