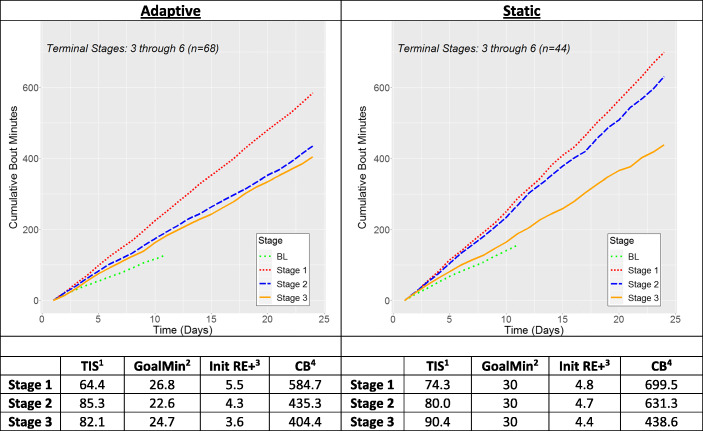
Fig. 4.
Summary of the differences in MVPA emitted as a function of reinforcement stage for Small Intervention Effect subgroup. The lines in each figure represent average cumulative bout-min of MVPA over the last 24 valid days in a stage (color figure available online). 1 TIS: Average time participant spent in stage (days). 2 GoalMin: Average goal for stage (min). 3 Init RE+: Initial contact with the reinforcer, measured by average number of goals met in first 10 days in stage. 4 Average total cumulative bouts in a stage (min)

