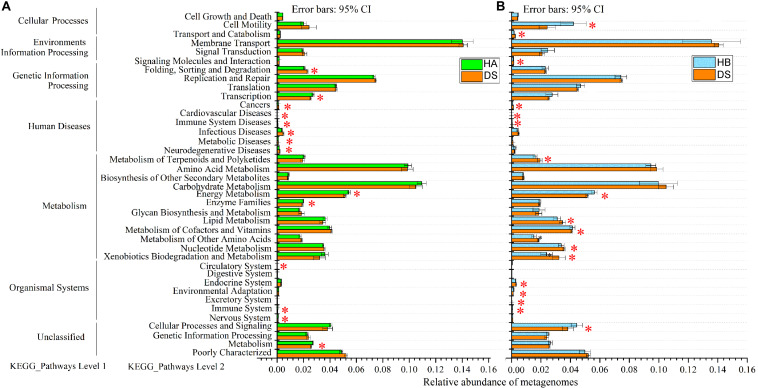
FIGURE 7.
Relative abundance of forecasted genes in the metagenome associated with level-1 and level-2 KEGG pathways. (A,B) Red, green, and blue boxes: DS, HA, and HB groups, respectively. The left, middle and right lists represent level-1 and level-2 KEGG pathways and the abundance of each pathway, respectively. Asterisks indicate significant differences among groups.

