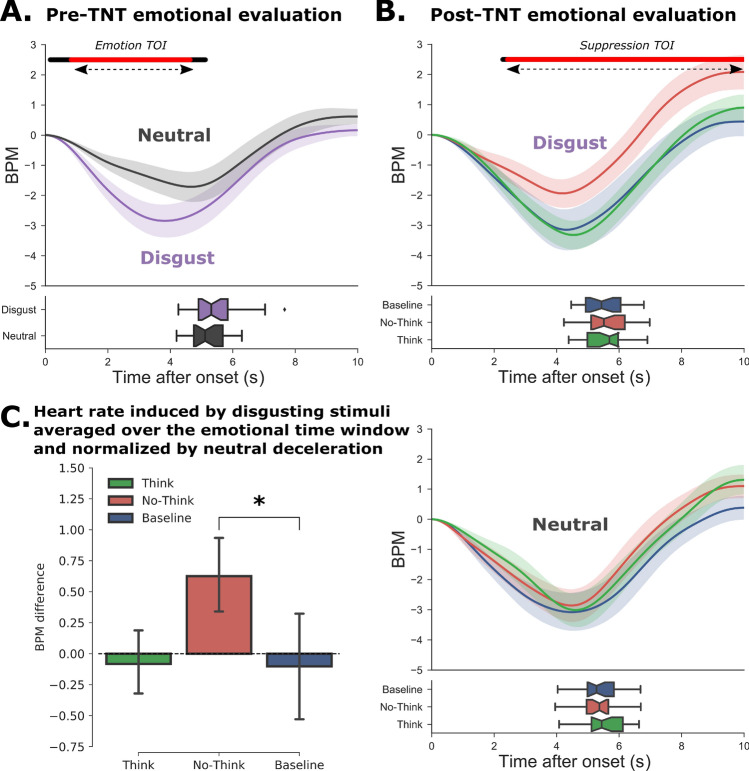
Figure 4.
Cardiac response to stimuli before and after the TNT task (Study 2). (A) Cardiac response following the initial presentation of the images before the TNT task. The curves represent the change in the number of heartbeats per minute (bpm), taking image onset as the starting point (i.e. 0 sec.). In the lower panel, the boxplots represent the distribution of response times for the valence ratings. (B) Cardiac response after the TNT task for disgusting (top panel) and neutral (bottom panel) images. For each emotion, the Think (green), No-Think (red) and baseline (blue) items are shown separately. We observed a significantly weaker heart rate deceleration for disgusting No-Think items, compared with baseline items. In Panels A and B, the black line shows the significant difference between neutral and disgust evoked responses, while the red line indicates the remaining significance after false discovery rate (FDR) correction. (C) The inhibition of cardiac response following memory suppression was observed even after controlling for the stronger deceleration observed for neutral items in the post-TNT assessment.

