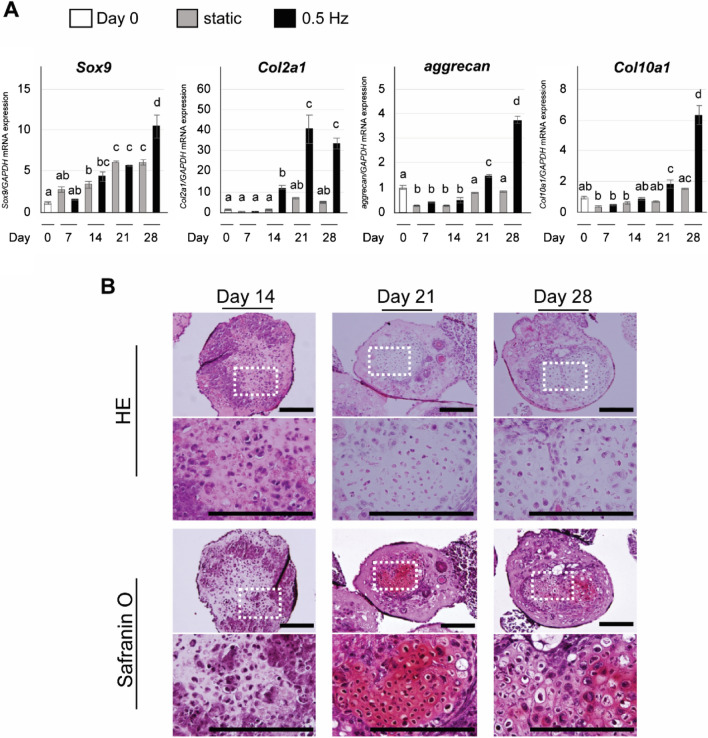
Figure 3.
Evaluation of chondrogenesis in CI-iPSC constructs under long-term shaking culture. (A) Gene expression of Sox9, Col2a1, aggrecan and Col10a1 was determined by quantitative real-time RT-PCR at days 0, 14, 21 and 28 under static and shaking conditions (0.5 Hz). Experiments were performed in triplicate and repeated three times with similar results. Representative data from three independent experiments are shown (mean values ± SD: n = 3). Different letters indicate significant differences between groups (P < 0.01, ANOVA with Tukey’s multiple comparison test). (B) Representative histological images of CI-iPSC constructs under shaking culture at 0.5 Hz. The second and fourth panels are magnifications of the dotted square regions. CI-iPSC constructs at days 14, 21 and 28 were stained with HE and Safranin O. Safranin O stained large rounded or oval cells resembling hypertrophic chondrocytes. Scale bars; 200 μm.

