Figure 1.
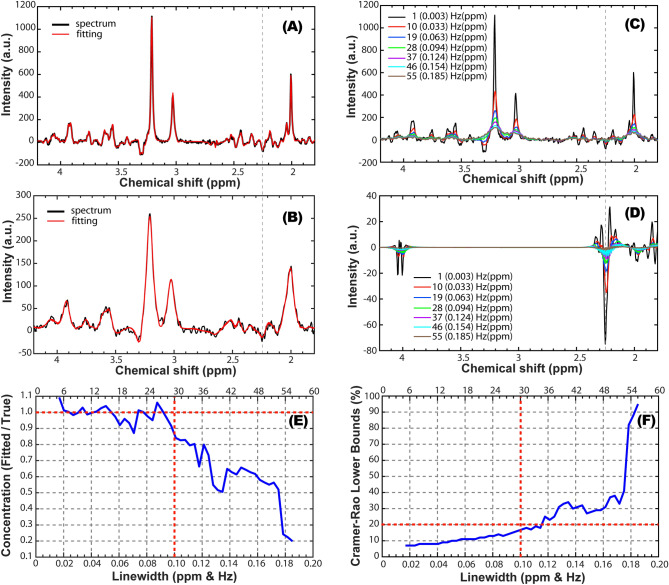
Simulations of brain spectra for 7 T and ASE excitation (TE1/TE2 = 50/28 ms) under increasing linewidths. (A) Simulated (black) and fitted (red) spectrum for LW = 3 Hz (0.01 ppm); (B) Simulated (black) and fitted (red) spectrum for LW = 30 Hz (0.1 ppm); (C) Overlay of simulated brain spectra for increasing linewidth; (D) Overlay of 2HG spectra fitted by LCModel in the simulated brain spectra for increasing linewidth; (E) Accuracy of 2HG fitting for increasing linewidth (1 ± 0.1 fit/true is considered acceptable interval; true value as dashed horizontal red line, vertical red line the maximum acceptable linewidth); (F) Precision of 2HG fitting for increasing linewidth (CRLB < 20% is considered acceptable precision; 20% marked by dashed horizontal red line, vertical red line the maximum acceptable linewidth). The vertical dashed line at 2.25 ppm in (A–D) indicates the position of the negative 2HG peak for TE = 78 ms.

