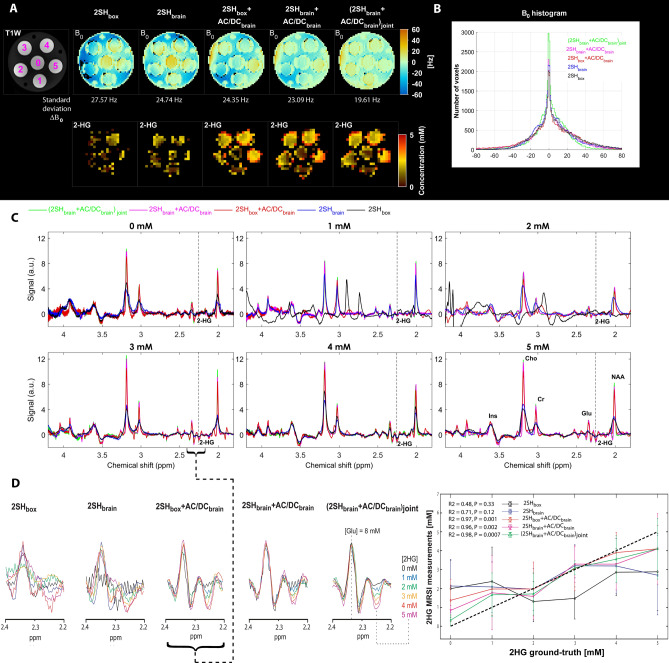
Figure 2.
Phantom measurements performed under five shimming conditions 2SHbox, 2SHbrain, 2SHbox + AC/DCbrain, 2SHbrain + AC/DCbrain, and (2SHbrain + AC/DCbrain)joint. (A) B0 fieldmaps maps of 2-HG and T1-weighted MRI with concentration of 2-HG marked on every tube 0, 1, 2, 3, 4, 5 mM (magenta). (B) Histogram distribution of the B0 fieldmaps for all shimming conditions. (C) spectra from each tube for each shimming method overlaid, the negative 2-HG peak at 2.25 ppm is indicated by vertical dashed lines. (D) Zoom on the 2.2–2.4 ppm spectral range that contains the positive glutamate peak at 2.35 ppm and negative 2HG peak at 2.25 ppm. Correlation analysis between fitted and ground-truth 2HG concentration for all shim conditions.

