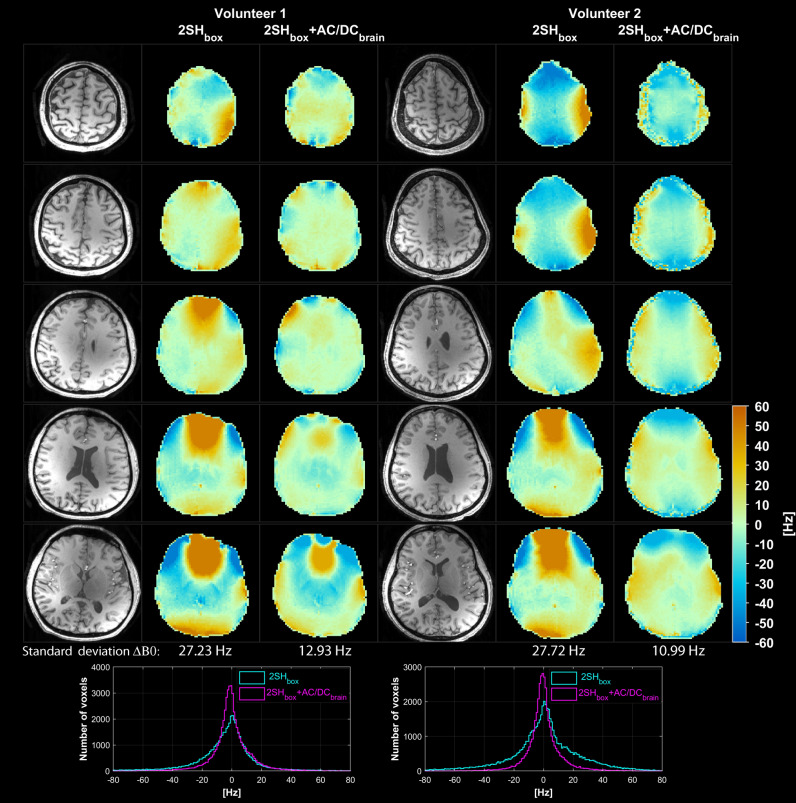
Figure 3.
Comparison of B0 homogeneity obtained with 2SHbox and 2SHbox + AC/DCbrain shimmings in the first two healthy volunteers. Five representative slices are shown throughout the shimmed brain slab, with the standard deviation of B0 distribution indicated below. Histograms of B0 distribution over the entire brain slab are shown overlaid at the bottom for both shimming methods. MEMPRAGE anatomical images are shown in the left most columns for each volunteer.

