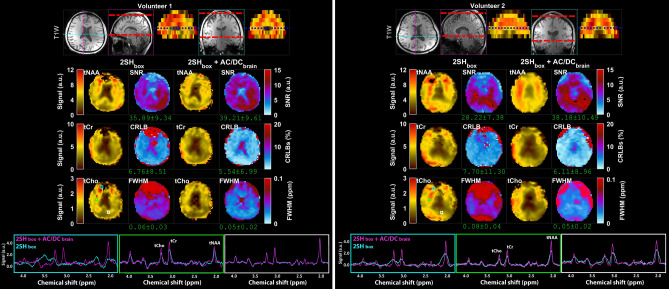
Figure 4.
Comparison of MRSI data obtained with 2SHbox and 2SHbox + AC/DCbrain shimmings in the first two healthy volunteers. An inferior axial slice is shown from the stack of 3D MRSI data as indicated by the blue dashed line in the coronal and sagital views at the top. The metabolic maps of total NAA (tNAA), total Choline (tCho), total Creatine (tCr), linewidth (FWHM), signal-to-noise ratio (SNR), and Cramer-Rao lower bounds (CRLB of tCr) are shown for both shimming methods. Examples of spectra from frontal (cyan box), central (green box), and occipital (white box) regions are shown overlaid for 2SHbox (cyan) and 2SHbox + AC/DCbrain (magenta). The values under the maps indicate the mean and standard deviation calculated over the whole-brain slab. MEMPRAGE anatomical images are shown at the top.

