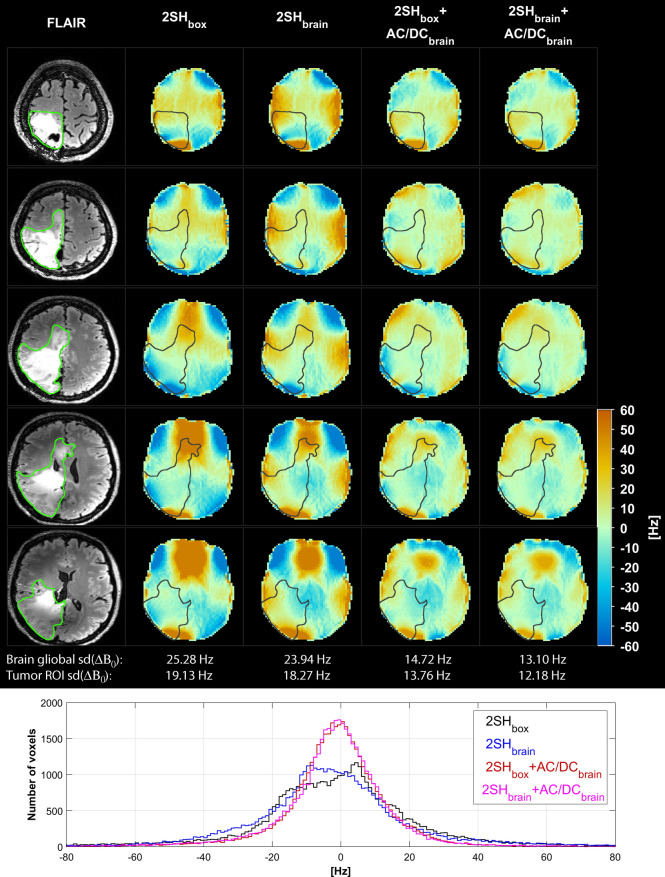
Figure 7.
Comparison of B0 fieldmaps in mutant IDH1 glioma patient under four shimming conditions 2SHbox, 2SHbrain, 2SHbox + AC/DCbrain, and 2SHbrain + AC/DCbrain. Five representative slices are shown through the shimmed whole-brain slab with the tumor ROI contours. Standard deviation of B0 distributions is given below for the entire slab and the tumor. Histograms of B0 distribution over the entire brain slab are shown overlaid at the bottom for all the shimming conditions. FLAIR anatomical image is shown on the left most column.

