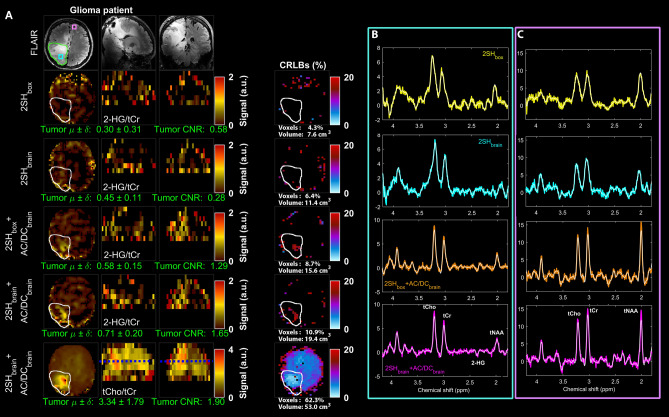
Figure 8.
Maps of the D-2-hydroxyglutarate to total creatine (2-HG/tCr) shown in axial, sagital, coronal views in the mutant IDH1 glioma patient obtained with the four shimming conditions 2SHbox, 2SHbrain, 2SHbox + AC/DCbrain, and 2SHbrain + AC/DCbrain. FLAIR image is shown at the top, and the map of total choline to total creatine (tCho/tCr) for 2SHbrain + AC/DCbrain shim is shown at the bottom. Cramer-Rao lower bounds (CRLB) maps are shown at the right of the metabolic maps. Below each metabolic map the mean and standard deviation of metabolic ratios in the tumor are calculated, and the contrast-to-noise ratio of the tumor. The tumor contours are indicated on the FLAIR and metabolic maps. The tumor 2HG volume detected with CRLB < 20% and the ratio of 2HG to FLAIR volume is indicated for each shimming under the CRLB maps. Examples of spectra from the tumor (B) and healthy brain (C) are shown for all shimming conditions in the right two columns. The maps of tNAA, tCho, tCr, SNR, FWHM and CRLB (of tCr) are shown in Supplementary Fig. 4.

