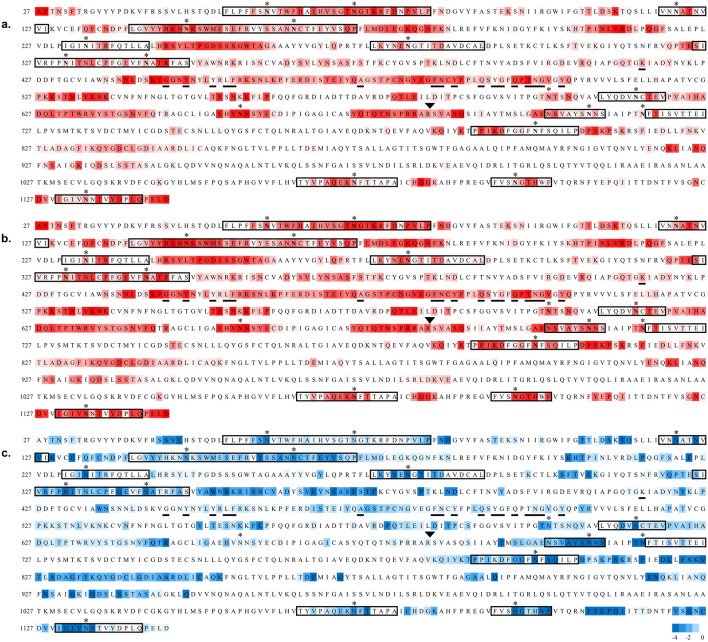
Figure 4.
Sequence of the S protein (NCBI: YP_009724390.1) used to generate the 3D model of the glycoprotein. Residues 1–26 and 1,147–1,273 were not included in the 3D structure due to a lack of relevant template structures. Sequences within a rectangle were predicted to consist of one or more HLA antigens using the RankPep server (imed.med.ucm.es/Tools/rankpep55,56). Glycosites are indicated with asterisks, residues reported to interact with the ACE2 receptor62 are underlined, and the protease cleavage site is indicated with a triangle above the RS junction. (a) The sequence is colored according to antibody accessibility computed for the site-specific glycoform from white to red (least to most accessible). (b) Antibody accessibility computed for the non-glycosylated (nude) protein. (c) The difference in accessibilities between the site-specific and non-glycosylated glycoforms is plotted as the fold change in epitope accessibility during the simulation, from − 4 (blue) to 0 (white), where blue indicates glycosylation-dependent surface shielding.

