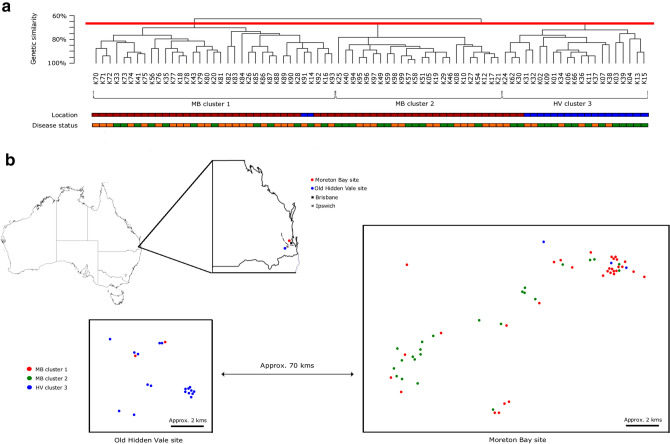
Figure 3.
(a) Cluster dendrogram of major histocompatibility complex (MHC) haplotypes indicating clustering by study site but not by disease progression (red line denotes > 65% genetically identical, red squares denote Moreton Bay site (MB), blue squares denote Old Hidden Vale site (HV), green squares denote developed disease during monitoring, orange squares denote did not develop disease during monitoring) (b) Schematic showing study sites and capture location of koalas within MHC haplotype clusters (dashed line denotes the Brisbane Valley biogeographical barrier) (created using Inkscape 0.92.3, https://inkscape.org/).

