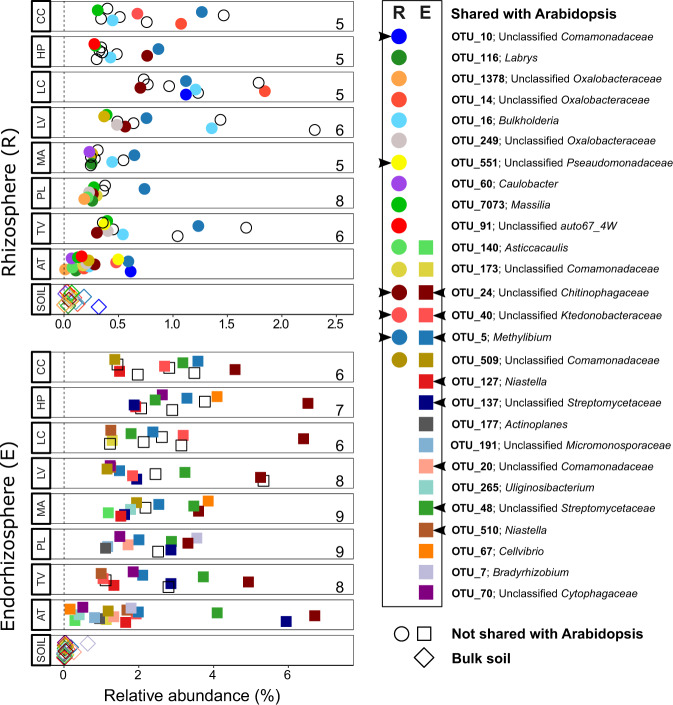
Fig. 4. A majority of highly abundant plant-enriched bacterial OTUs is shared with Arabidopsis.
For each plant species (“y-axis”), the top 10 most abundant enriched bacterial OTUs from the rhizosphere (circles) and the endorhizosphere (squares) are plotted according to their mean relative abundance (x-axis). Colored filled shapes indicate OTUs also enriched in Arabidopsis, either in the rhizosphere (R), endorhizosphere (E), or both. Black open shapes represent OTUs not significantly enriched in Arabidopsis. The relative abundance of the shared OTUs in the soil is presented in the bottom row of each panel. Numbers inside each plot indicate how many OTUs in the top 10 are shared between the respective plant species and Arabidopsis. Arrowheads in the legend panel indicate OTUs that are also part of the Arabidopsis top 10 enriched OTUs. AT A. thaliana, CC C. capillaris, HP H. perforatum, LC L. corniculatus, LV L. vulgare, MA M. arvensis, PL P. lanceolata, TO T. officinale, TV T. vulgare.

