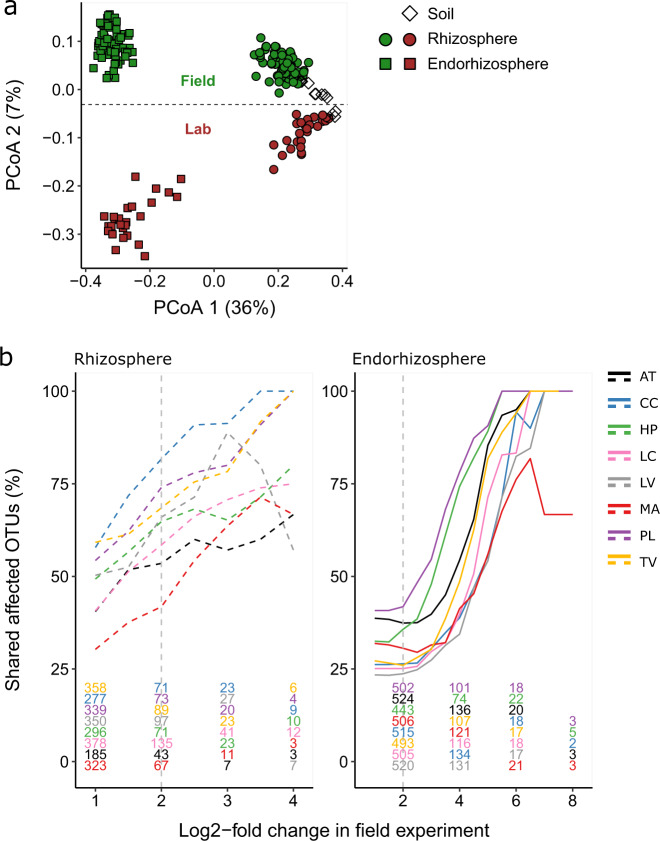
Fig. 7. The rhizosphere effect can be reconstituted in a laboratory experiment.
a Principal coordinate analysis of soil, rhizosphere and endorhizosphere samples of all the plant species (not per species indicated). The first PC axis separates the compartment. The second axis separates the lab and the field experiment with a relatively low amount of variance explained. b Each significantly affected OTU from the field experiment (see Fig. 3b, c) was tested for significance in the lab experiment. The absolute number of affected OTUs in the field experiment is indicated by the colored numbers at the bottom, and overlap with the laboratory experiment is plotted as a percentage of the total number of affected OTUs. The percentage of overlapping OTUs increases with log2-fold thresholds (1–8, x-axis), indicating that strongly affected OTUs are more likely to be affected in the lab experiment as well. Colors represent different plant rhizospheres (dotted lines) or endorhizospheres (solid lines). AT A thaliana, CC C. capillaris, HP H. perforatum, LC L. corniculatus, LV L. vulgare, MA M. arvensis, PL P. lanceolata, TO T. officinale, TV T. vulgare.

