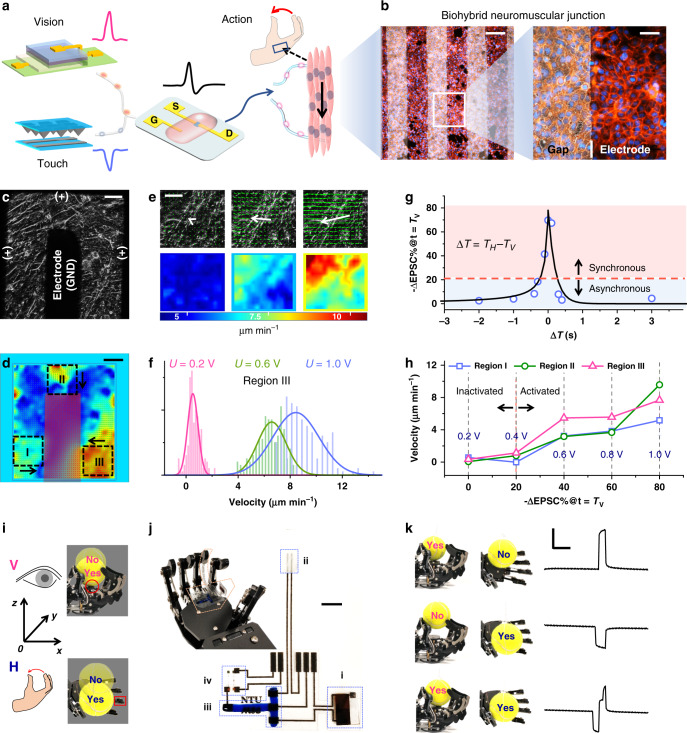
Fig. 3. The visual-haptic fusion based on BASE patch for motion control.
a The schematic of visual-haptic fusion for muscle actuation. b Confocal fluorescent imaging of biohybrid neuromuscular junction. The scale bar is 200 μm (left) and 50 μm (right), respectively. c Phase contrast image of a target-area (7.3 × 7.3 mm2) in the biohybrid neuromuscular junction. The scale bar is 1 mm. d Representative speed magnitude mapping of the target-area under 1.0 V stimulation. Region I to III indicate three robust regions of interest. The arrows indicate the dominant myotubes motion direction. The scale bar is 1 mm. e Representative mapping of the velocity vector (upper row) and speed magnitude (|v|, lower row) in Region III, under stimuli of 0.2 V, 0.6 V, and 1.0 V bias. The white arrows indicate the mean velocity vector. The scale bar is 200 μm. f Histogram plot of the motion velocity under 0.2 V, 0.6 V, and 1.0 V. Solid curves: Gaussian fitting of the histogram. g Plot of the relative change of ∆EPSC% as a function of the time interval (ΔT). The voltage applied on the photodetector and pressure sensor is positive (VV = 1.0 V) and negative (VH = −1.0 V), respectively. In all, 20% is defined as the criterion of synchronization. h The mean speed of region I to III in response to different EPSC changes. The texts in blue indicate the applied voltage converted from ΔEPSC%. i The “YES” and “NO” positions inferred by visual (top, pink) or haptic (bottom, blue) feedback. If the ball could be held by the robotic hand based on one sensory feedback, then the position is annotated as “YES” otherwise “NO”. j The modified BASE patch on the robotic hand and the magnified image of the BASE patch. The scale bar is 5 mm. k The ΔEPSC of the BASE with the ball at different positions (V = YES, H = NO; V = NO, H = YES; V = YES, H = NO) through the exploration process. The scale bars are 1 μA and 1 s for y-axis and x-axis, respectively.

