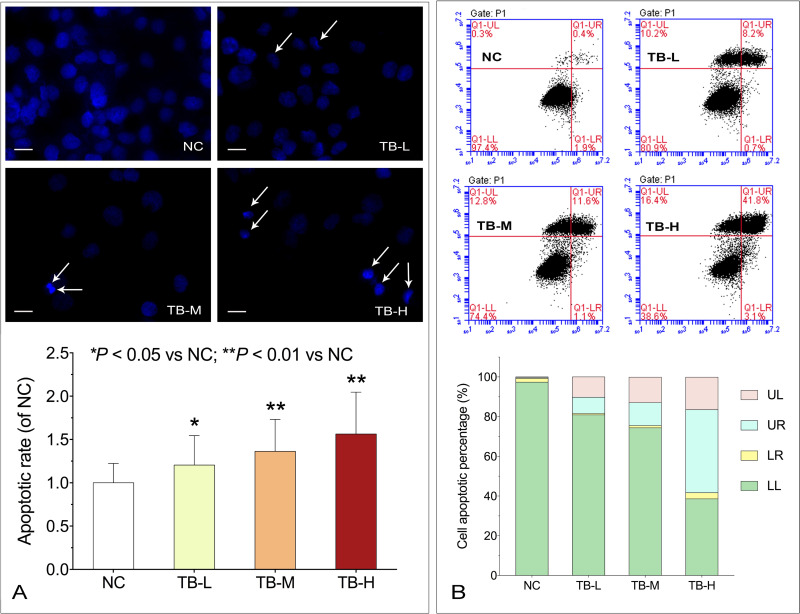
Figure 2.
(A) Apoptotic morphology of Huh7 cells with TB treatment by DAPI staining. Scale bar: 50 µm. Values were presented as the mean ± SD (n = 5). *P < 0.05 and **P < 0.01 vs normal control. (B) Flow cytometry analysis on Huh7 cell apoptosis with TB treatment.
Abbreviations: TB, theabrownin; DAPI, 4′,6-diamidino-2-phenylindole; NC, normal control; TB-L, low dose of theabrownin; TB-M, medium dose of theabrownin; TB-H, high dose of theabrownin; UL, upper left quadrant; UR, upper right quadrant; LR, lower right quadrant; LL, lower left quadrant.

