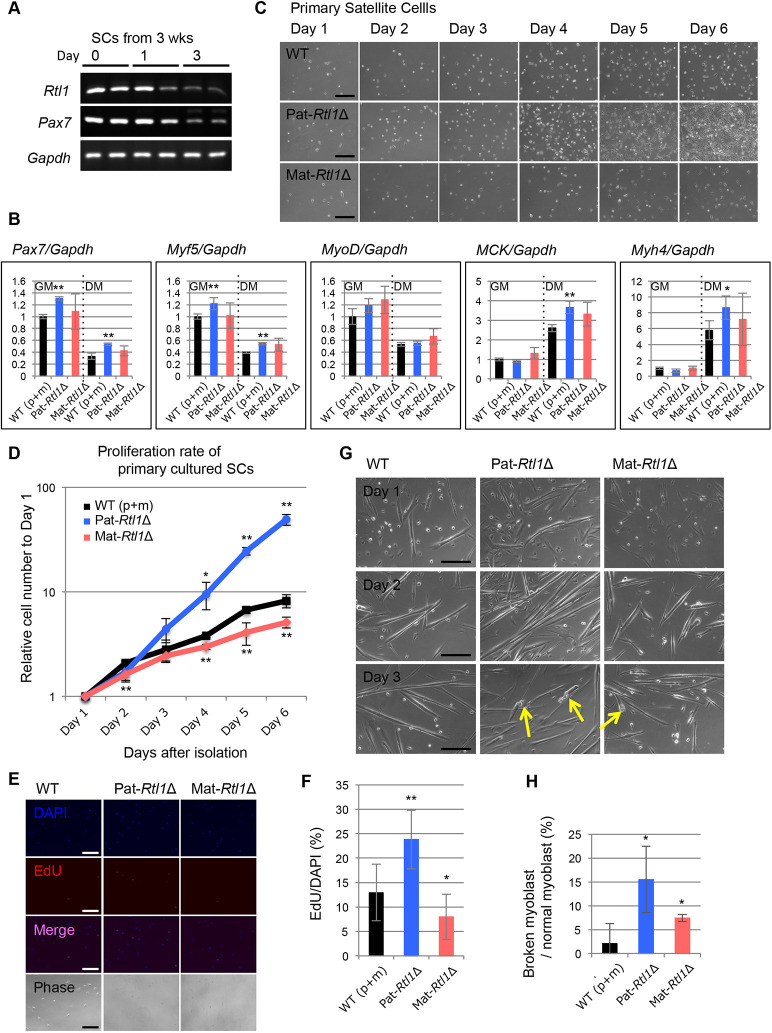
Fig. 4.
Rtl1 expression during differentiation of SCs. (A) Expression of Rtl1 in primary cultured SCs. SCs during proliferation (day 0) and after the induction of differentiation (1 and 3 days) are shown. Gapdh was used as the control. Results after 35 cycles of amplification were shown. (B) Expression of several muscle marker genes in proliferating and differentiating SCs. SCs during proliferation (left; GM, growth medium) and 3 days after inducing differentiation (right; DM, differentiation medium) of wild type (black, n=6), Pat-Rtl1Δ (blue, n=3) and Mat-RtlΔ (red, n=3). Gapdh was used as the control. *P<0.05, **P<0.01 (two-tailed Student's t-test). Data are mean±s.d. (C) Phase-contrast microscopic images of wild-type, Pat-Rtl1Δ and Mat-Rtl1Δ SC proliferation from day 0 to day 6. Scale bars: 200 μm. (D) In vitro cell proliferation assay of wild-type (black, n=6), Pat-Rtl1Δ (blue, n=3) and Mat-Rtl1Δ (red, n=3) SCs. *P<0.05, **P<0.01 (two-tailed Student's t-test). Data are mean±s.d. (E) EdU incorporation in primary SCs. Immunofluorescence staining of DAPI (blue) and EdU (red), and their merged and phase-contrast microscopic images. Scale bars: 200 μm. (F) Comparison of the growth rates of wild-type (black, n=12), Pat-Rtl1Δ (blue, n=6) and Mat-Rtl1Δ (red, n=6) SCs. *P<0.05, **P<0.01 (two-tailed Student's t-test. Data are mean±s.d. (G) Phase-contrast microscopic images of SCs inducing differentiation from day 1 to day 3. The arrows indicate detached and rounded myoblasts. Scale bars: 200 μm. (H) Comparison of the broken myoblast of the wild-type (black, n=10), Pat-Rtl1Δ (blue, n=5) and Mat-Rtl1Δ (red, n=5) SCs. *P<0.05 (two-tailed Student's t-test). Data are mean±s.d.

