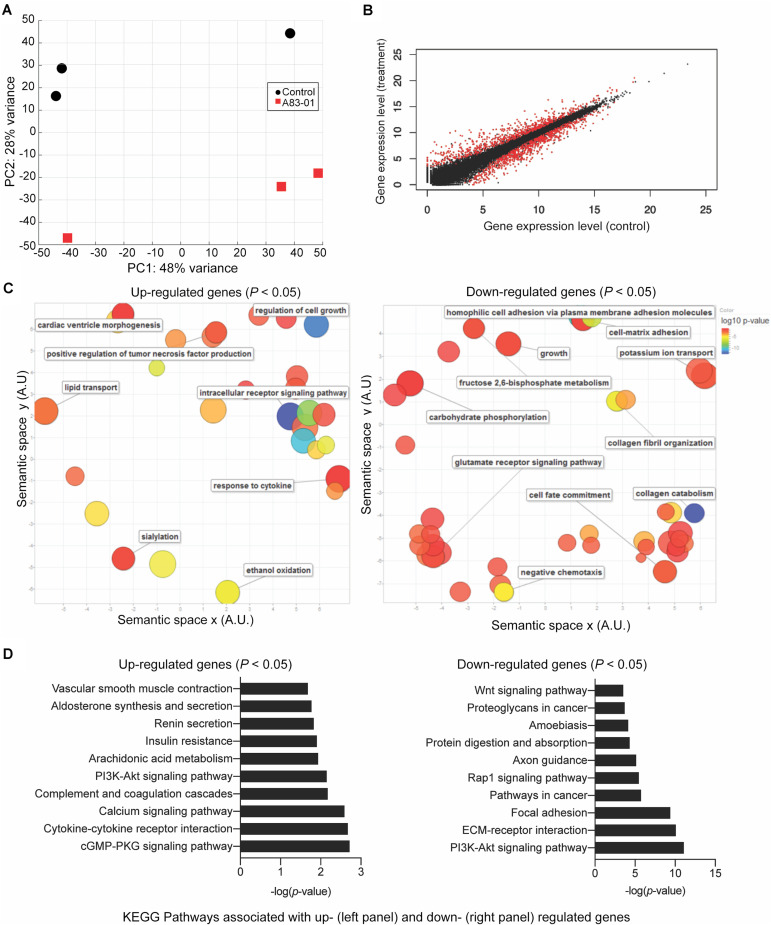
FIGURE 2.
Transcriptomic profile of eMSC upon sustained A83-01 treatment. (A) Principal component analysis of RNA-seq data from three independent primary eMSC cultures treated with or without TGFβ-R inhibitor for 36 days. (B) Average gene expression levels expressed as log2 transformed counts normalized to library size between control and A83-01 treated libraries. Red dots represent significantly differentially expressed genes (q < 0.05), black dots indicate non-differentially expressed genes. (C) Semantic clustering of significantly overrepresented GO terms (p < 0.05) of differentially induced and repressed genes (left and right panel, respectively) upon A83-01 treatment. The color key is shown on the right. The most highly enriched GO categories are indicated in blue. The size of the circles reflects the frequency of the GO term. (D) Enrichment analysis of KEGG pathways associated with up- and down-regulated genes (left and right panels, respectively).

