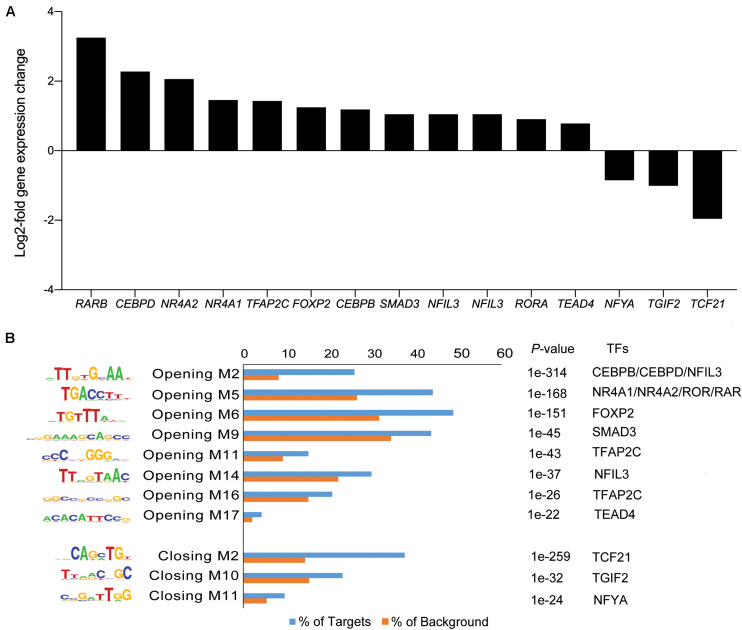
FIGURE 5.
Motif discovery analysis in dynamic genomic regions. (A) Inhibition of TGFβ-R signaling pathway alters expression of genes encoding TFs. Graph shows expression of selected significantly up- and down-regulated TFs (log2-fold change ≥ 1 and ≤ -1). (B) Differentially regulated TFs matched to enriched and depleted short sequence binding motifs. Bar graph showing enriched and depleted binding motifs coupled with the most plausible differentially expressed TFs, based on motif specificity. In the bar graph, the frequency (%) of peaks (blue bars) containing the motif is shown relative to genomic regions randomly selected from the genome (orange bars) (±50 kb from TSS, matching size, and GC/CpG content). P indicates the p-value of the short sequence binding motifs.

