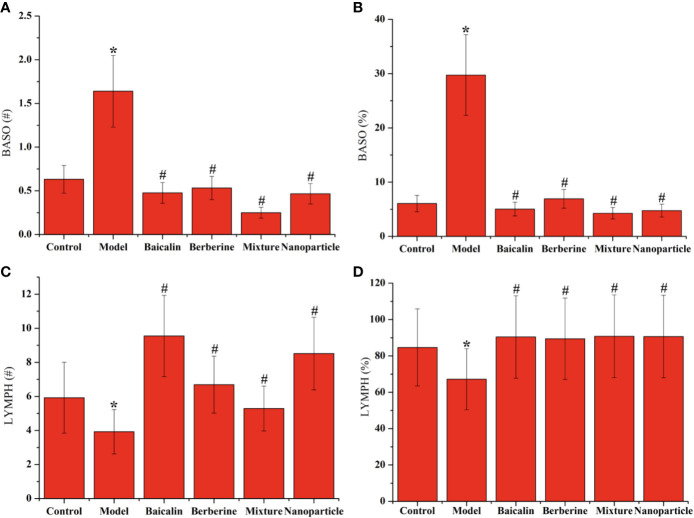
Figure 5.
Levels of BASO and LYMPH in whole blood. (A) BASO# of whole blood. (B) BASO% of whole blood. (C) LYMPH# of whole blood. (D) LYMPH% of whole blood. ANOVA with the post hoc test was used to calculate the significance of the differences, * and # represents P < 0.05 compared with the control and model group, respectively. The results are expressed as the mean ± S.D.

