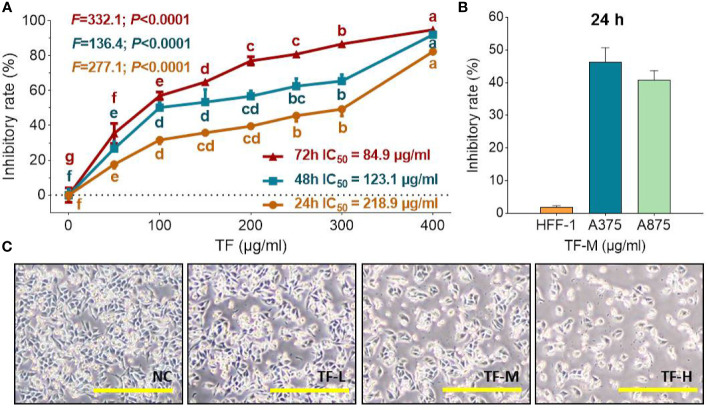
Figure 1.
Cell viability of A375 cells with TF treatment at 24, 48, and 72 h (A), cell viability of HFF-1, A375, and A875 cells with TF treatment at 24 h (B), and morphology of A375 cells with theaflavin (TF) treatment at 24 h (C). Data were mean ± SD (n = 5). By means of Fisher’s least significant difference (LSD) multiple comparisons, data (mean ± SD) with same lowercase letter (b vs. bc; bc vs. cd; c vs. c; cd vs. d; d vs. d) indicate no significant difference between each other, while data with different letters (a vs. b vs. c vs. b vs. e vs. f vs. g) indicate significant difference with each other. Scale bar = 200 μm.

