
Fig. 4. Distribution of glycoside hydrolase (GH) and pectin lyase (PL) families in the transcriptome of the four symbiotic protists in Coptotermus formosanus.
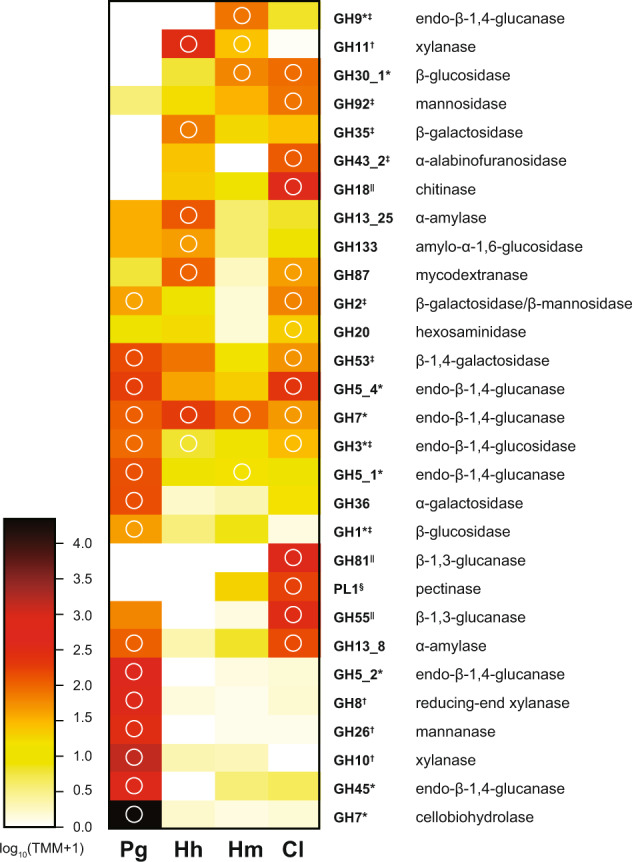
The color intensity of the heatmap shows the expression level of the GH/PL family. The expressions are represented by the average of trimmed mean of M (TMM) of the gene for the GH/PL family in the three cells. GH/PL family was sorted according to the result of clustering. The predicted activities of each GH/PL family are shown. GH/PL families digesting cellulose, hemicellulose, pectin, and fungal cell walls are indicated by an asterisk, dagger, double dagger, and section, respectively. White circles indicate GH/PL families that include the gene(s) of which TMM is larger than 100 at least in 2 of 3 replicates. Pg, Hh, Hm, Cl represents Pseudotrichonympha grassii, Holomastigotoides hartmanni, Holomastigotoides minor, and Cononympha leidyi, respectively.