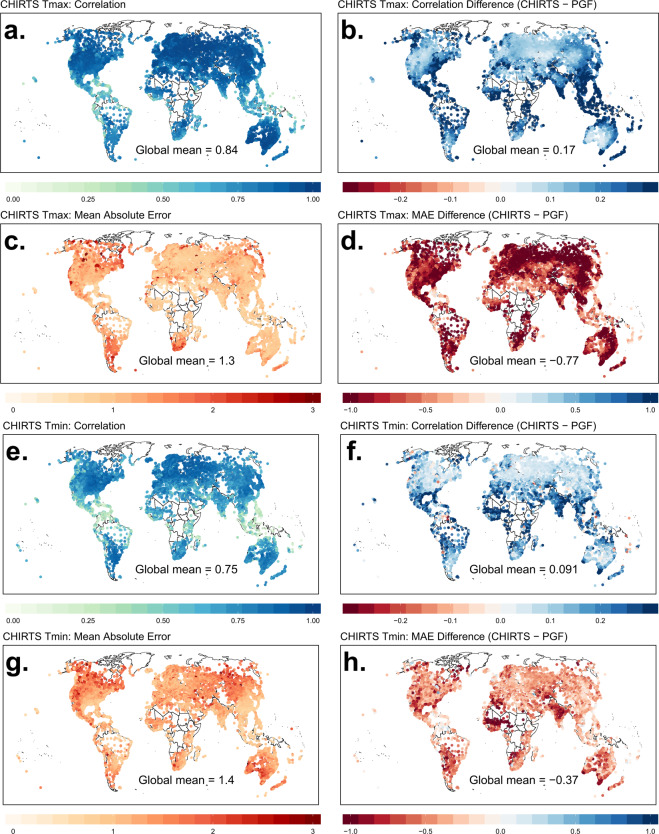
Fig. 2.
Validation statistics for maximum and minimum temperatures and a comparison between CHIRTS and PGF. (a) Correlation between CHIRTSX and validation data sets. (b) Difference between correlations for CHIRTSX and PGFX. c. Mean absolute error of CHIRTSX with respect to validation data sets. (d) Difference between mean absolute errors for CHIRTSX and PGFX. (e) Correlation between CHIRTSN and validation data sets. (f) Difference between correlations for CHIRTSN and PGFN. (g) Mean absolute error of CHIRTSN with respect to validation data sets. (h) Difference between mean absolute errors for CHIRTSN and PGFN.

