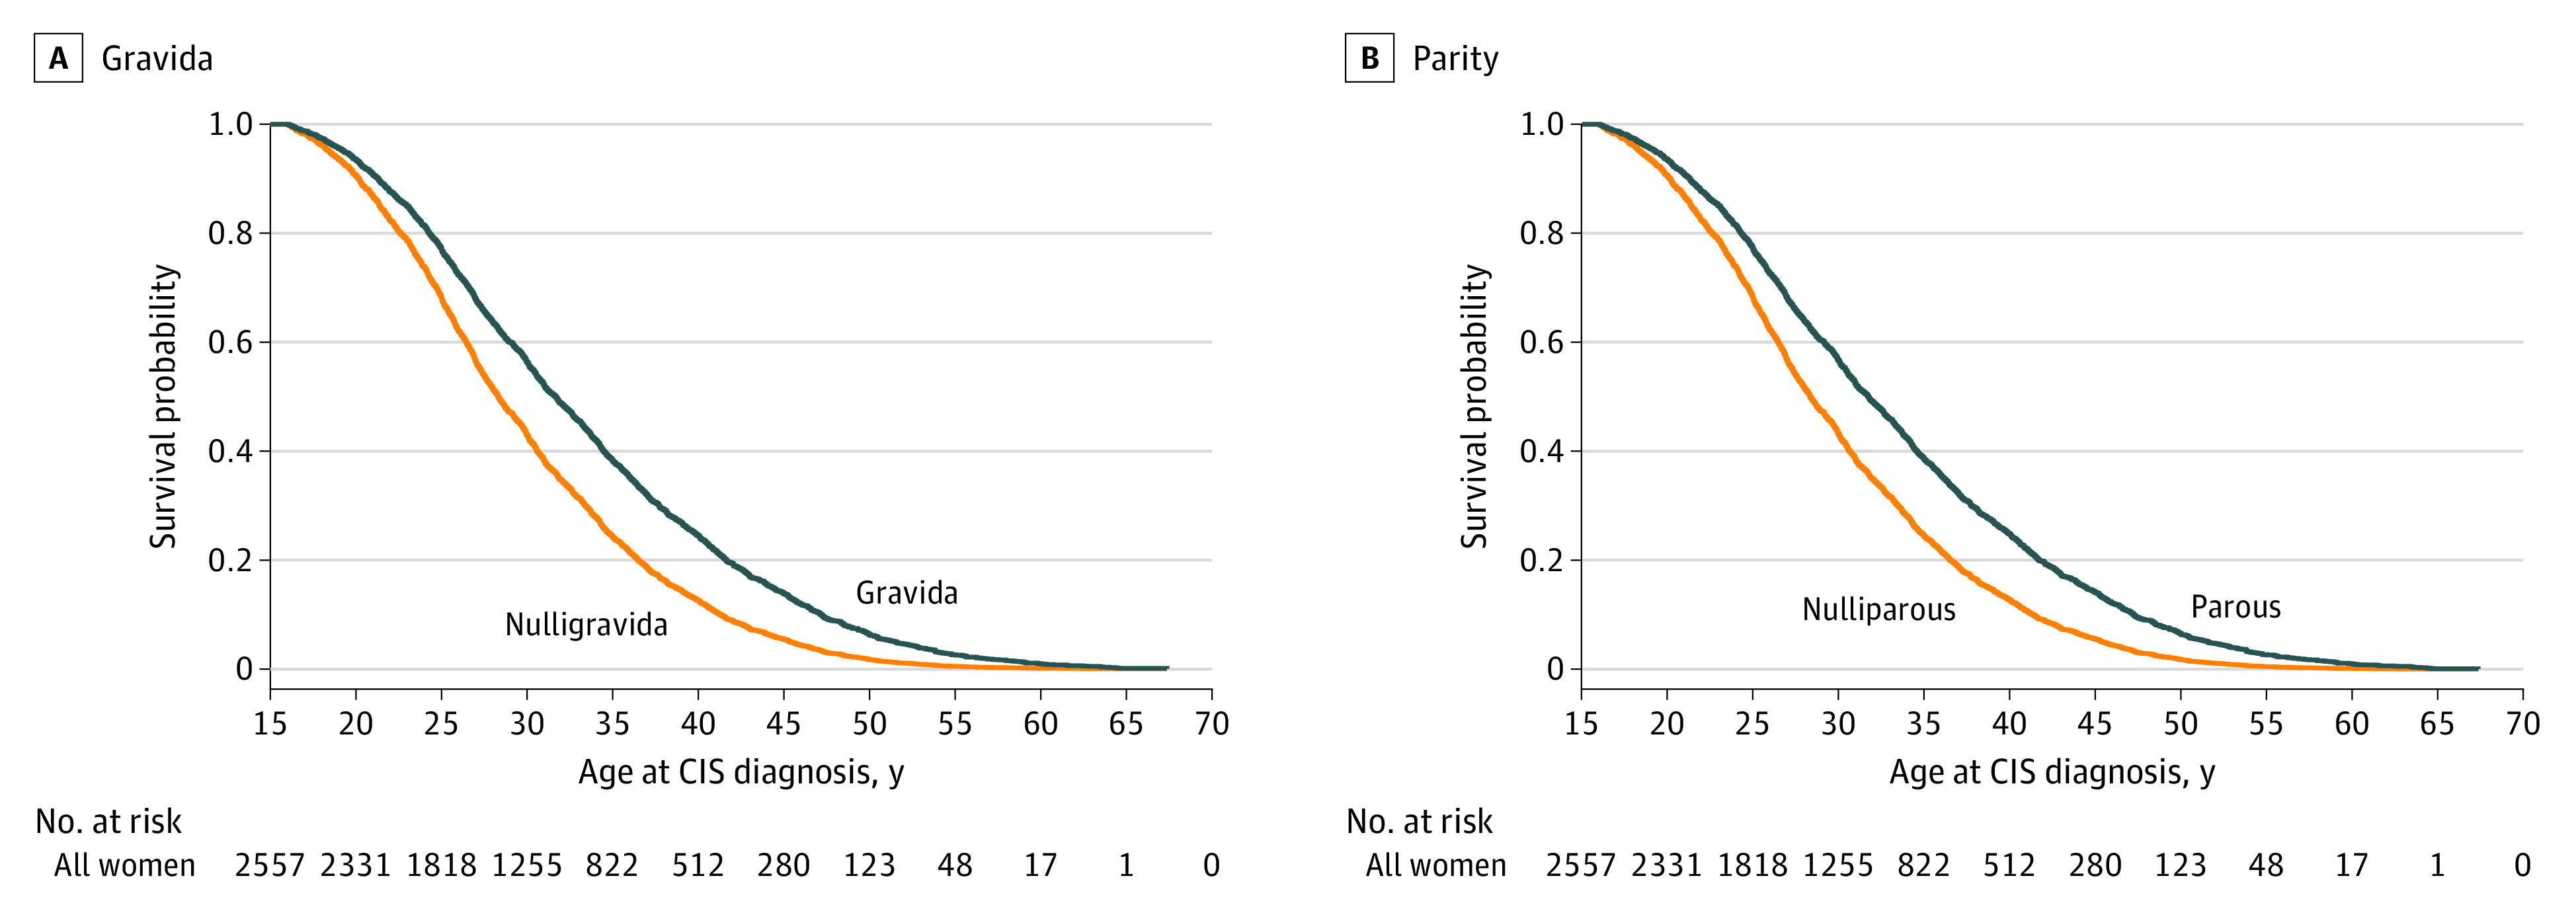
Figure 2. Adjusted Cox Proportional Hazards Regression Model Curves for Time to Clinically Isolated Syndrome (CIS) Onset by Gravida and Parity.

Cox model curves were adjusted for site, which was fixed to the level with the maximum participants (Charles University and General University Hospital). Kaplan-Meier curves using the Simon and Makuch method are shown in the eFigure in the Supplement.
