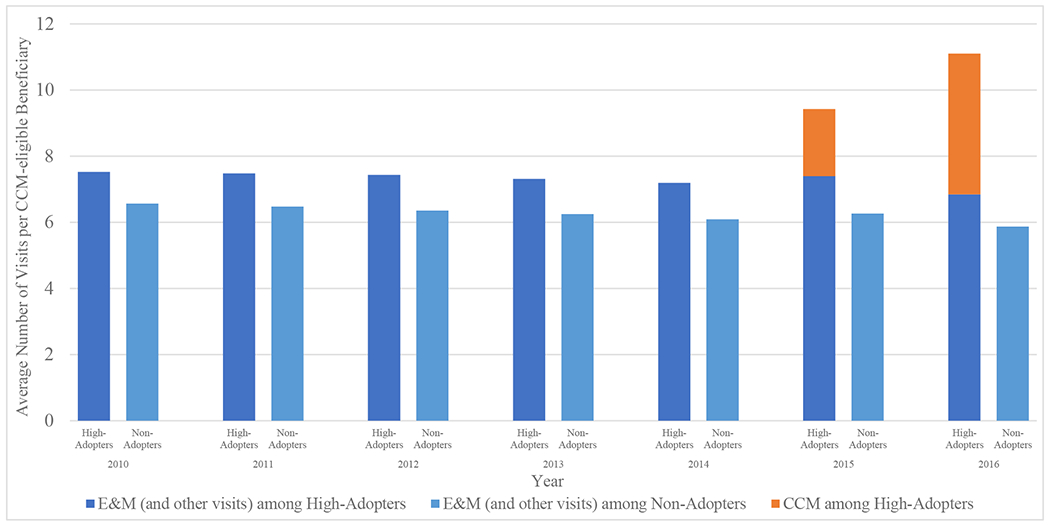
Exhibit 4:

Potential substitutive versus additive effects on traditional offices visits from adoption of CCM, 2010–2016
Source: Authors’ analysis of data for a 20% random sample of Medicare beneficiaries. Notes: We calculated the number of visits received at each practice per eligible beneficiary (i.e. at least 2 chronic conditions). Baseline office visits included evaluation and management (E&M) visits and other types of office visits i.e. annual wellness visits (AWV) and TCM. High-adopters (n = 577) included those practices (with or without a primary care physician) that were in the top quartile of delivering CCM services to their eligible patients. Non-adopters (n = 31,212) provided CCM to 0% of their eligible patients.
| E&M (and other visits) among High-Adopters | E&M (and other visits) among Non-Adopters | CCM among High-Adopters | CCM among Non-Adopters | ||
|---|---|---|---|---|---|
| 2010 | High-Adopters | 7.52 | 0 | ||
| Non-Adopters | 6.56 | 0 | |||
| 2011 | High-Adopters | 7.48 | 0 | ||
| Non-Adopters | 6.47 | 0 | |||
| 2012 | High-Adopters | 7.43 | 0 | ||
| Non-Adopters | 6.35 | 0 | |||
| 2013 | High-Adopters | 7.31 | 0 | ||
| Non-Adopters | 6.25 | 0 | |||
| 2014 | High-Adopters | 7.19 | 0 | ||
| Non-Adopters | 6.09 | 0 | |||
| 2015 | High-Adopters | 7.39 | 2.03 | ||
| Non-Adopters | 6.26 | 0 | |||
| 2016 | High-Adopters | 6.84 | 4.26 | ||
| Non-Adopters | 5.87 | 0 |
