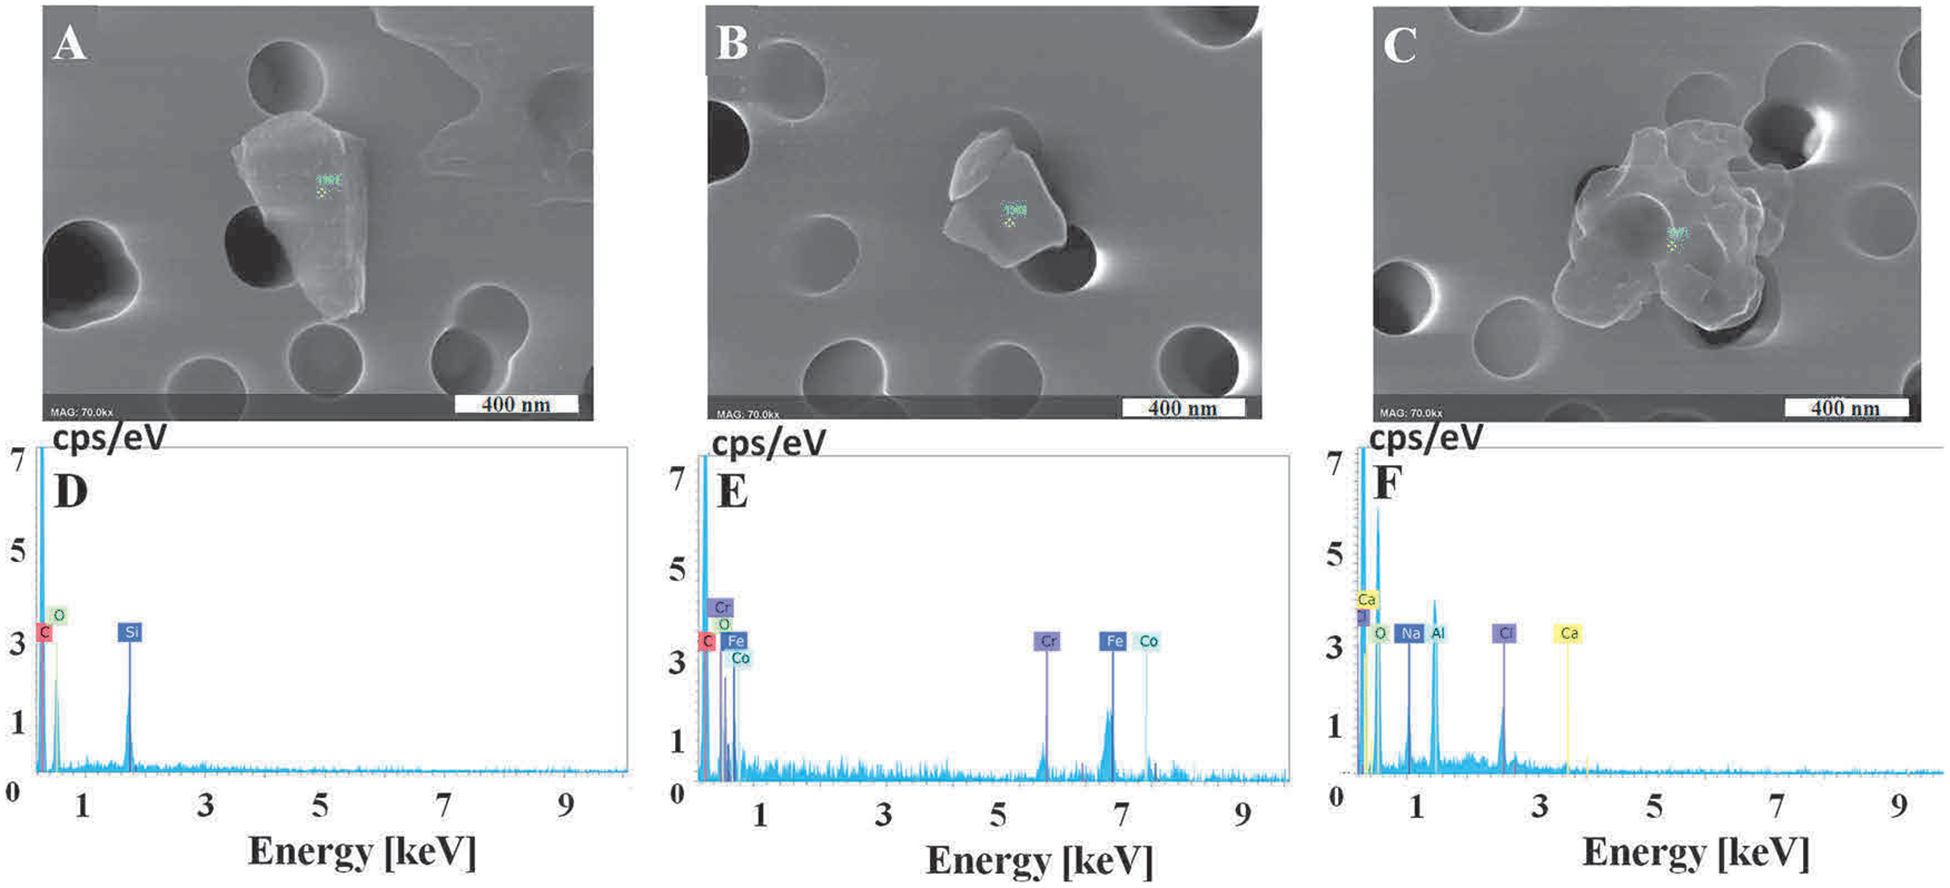
Fig. 2.

Representative images of 3-D printer-emitted particles collected in the cell culture medium indicating surface morphology and elemental composition. 3-D printer emissions were collected in cell culture medium, passed through a track-etched polycarbonate filter, and analyzed using FE-SEM (A–C) and EDX (D–F). (A) Background, (B) PC, (C) ABS. D–F are representative elemental analysis spectra for A–C. Magnification at 70k × for all images, scale bar at 400 nm.
