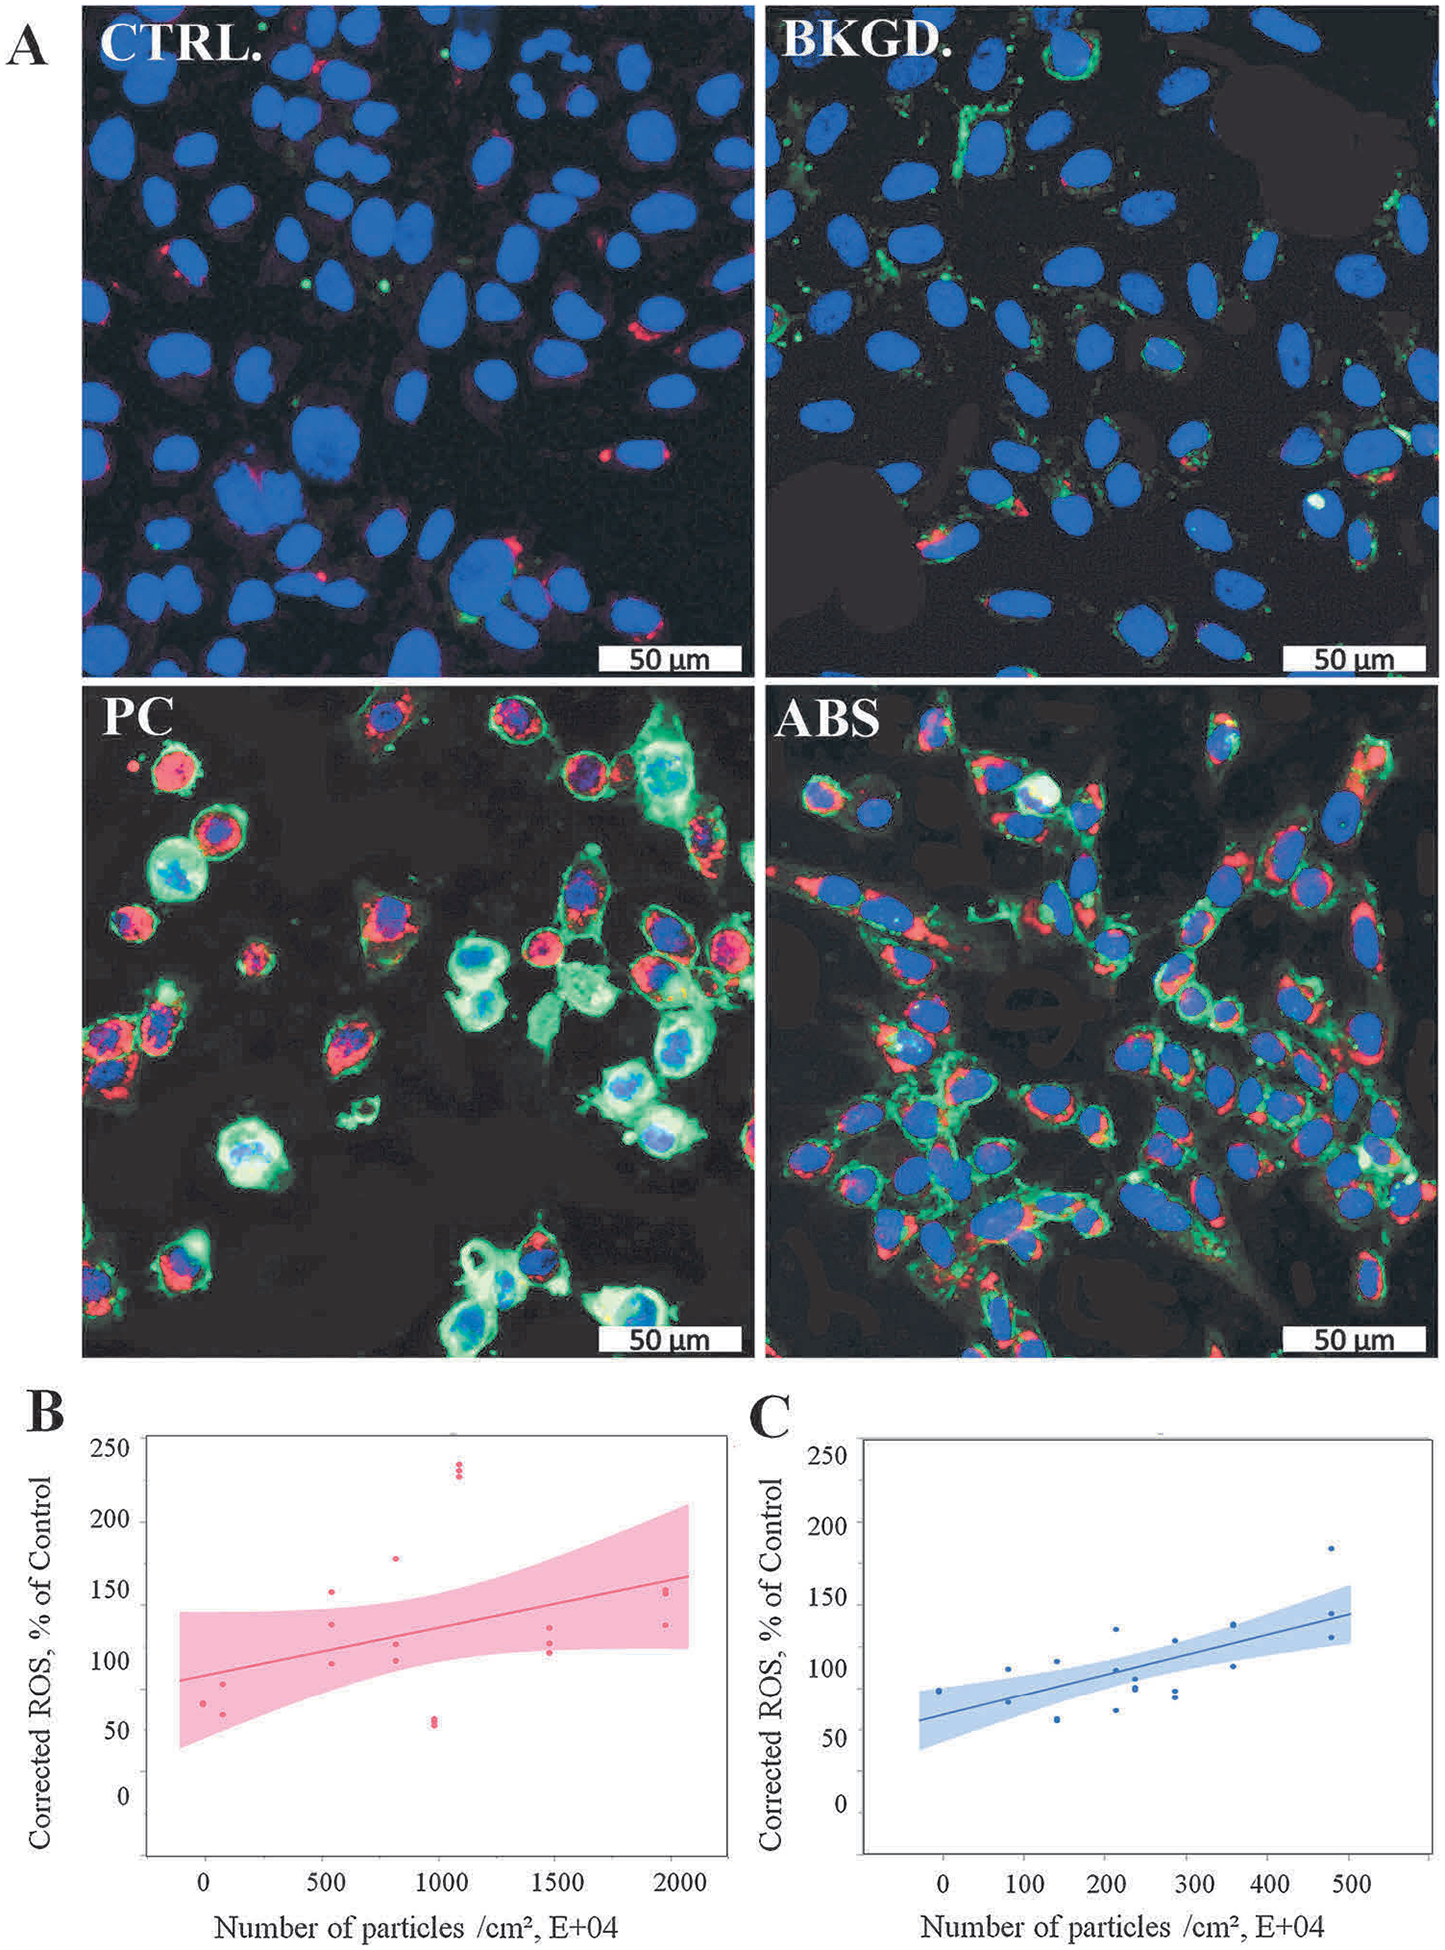
Fig. 5.

ROS production following exposure to 3-D printer-emitted particles collected in the cell culture medium. SAEC were stained with a cocktail consisting of 5 μM CellROX™ Deep Red reagent, 5 μg/mL of CellMask™ Orange plasma membrane stain, and 1 μM Hoechst 33342 fluorescent nuclear stain. (A) Representative confocal images of untreated cells, and cells exposed to background, PC, and ABS collected emissions for 24 h. Quantitative ROS levels of PC (B) and ABS (C) using high content screening. Magnification at 20× and scale bars are at 50 μm for all images. Experiments were performed in three independent experiments with n = 6 replicates each. The regressions lines illustrate a significantly (p < 0.0001) increased dose-response relationship between ROS production and the numbers of the PC and ABS 3-D printer-emitted particles. The shaded area represents the 95% confidence interval around the regression line.
