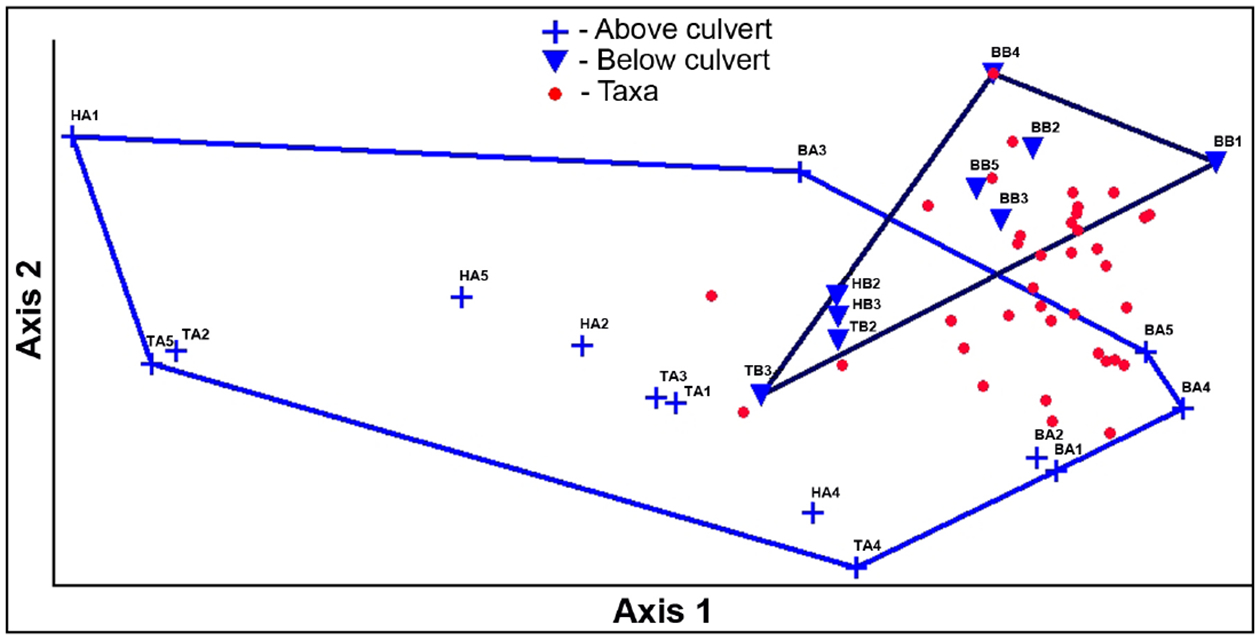
Figure 12.

Grouping of macroinvertebrate assemblages by location. Results of nonmetric multidimensional scaling (NMDS) analysis of the samples plotted in taxa space showing grouping. [Sample codes: First letter indicates the method (B-bucket, T = tray, H = MHD); second letter indicates location (A = above culvert, B = below culvert); number indicates the replicate.]
