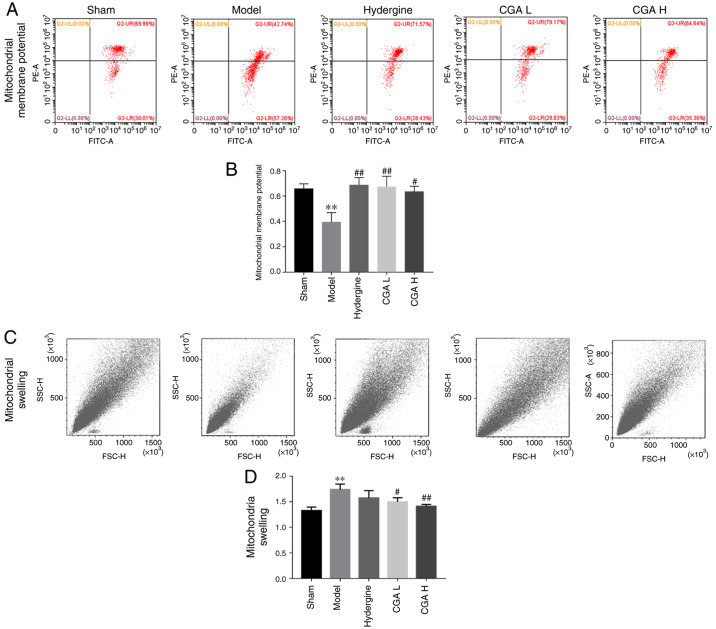
Figure 3.
Effect of CGA on hippocampal mitochondrial function in rats with MID. Flow cytometry (A) analysis and (B) quantification of mitochondrial membrane potential. Flow cytometry (C) analysis and (D) quantification of mitrochondrial swelling. **P<0.01 vs. the sham group; #P<0.05 and ##P<0.01 vs. the model group CGA, compatibility of ginsenosides and astragalosides; MID, multi-infarct dementia; CGA H, high-dose CGA; CGA L, low-dose CGA; PE-A, phycoerythrin-A; SSC-H, side scatter-height; FSC-H, forward scatter-height.

