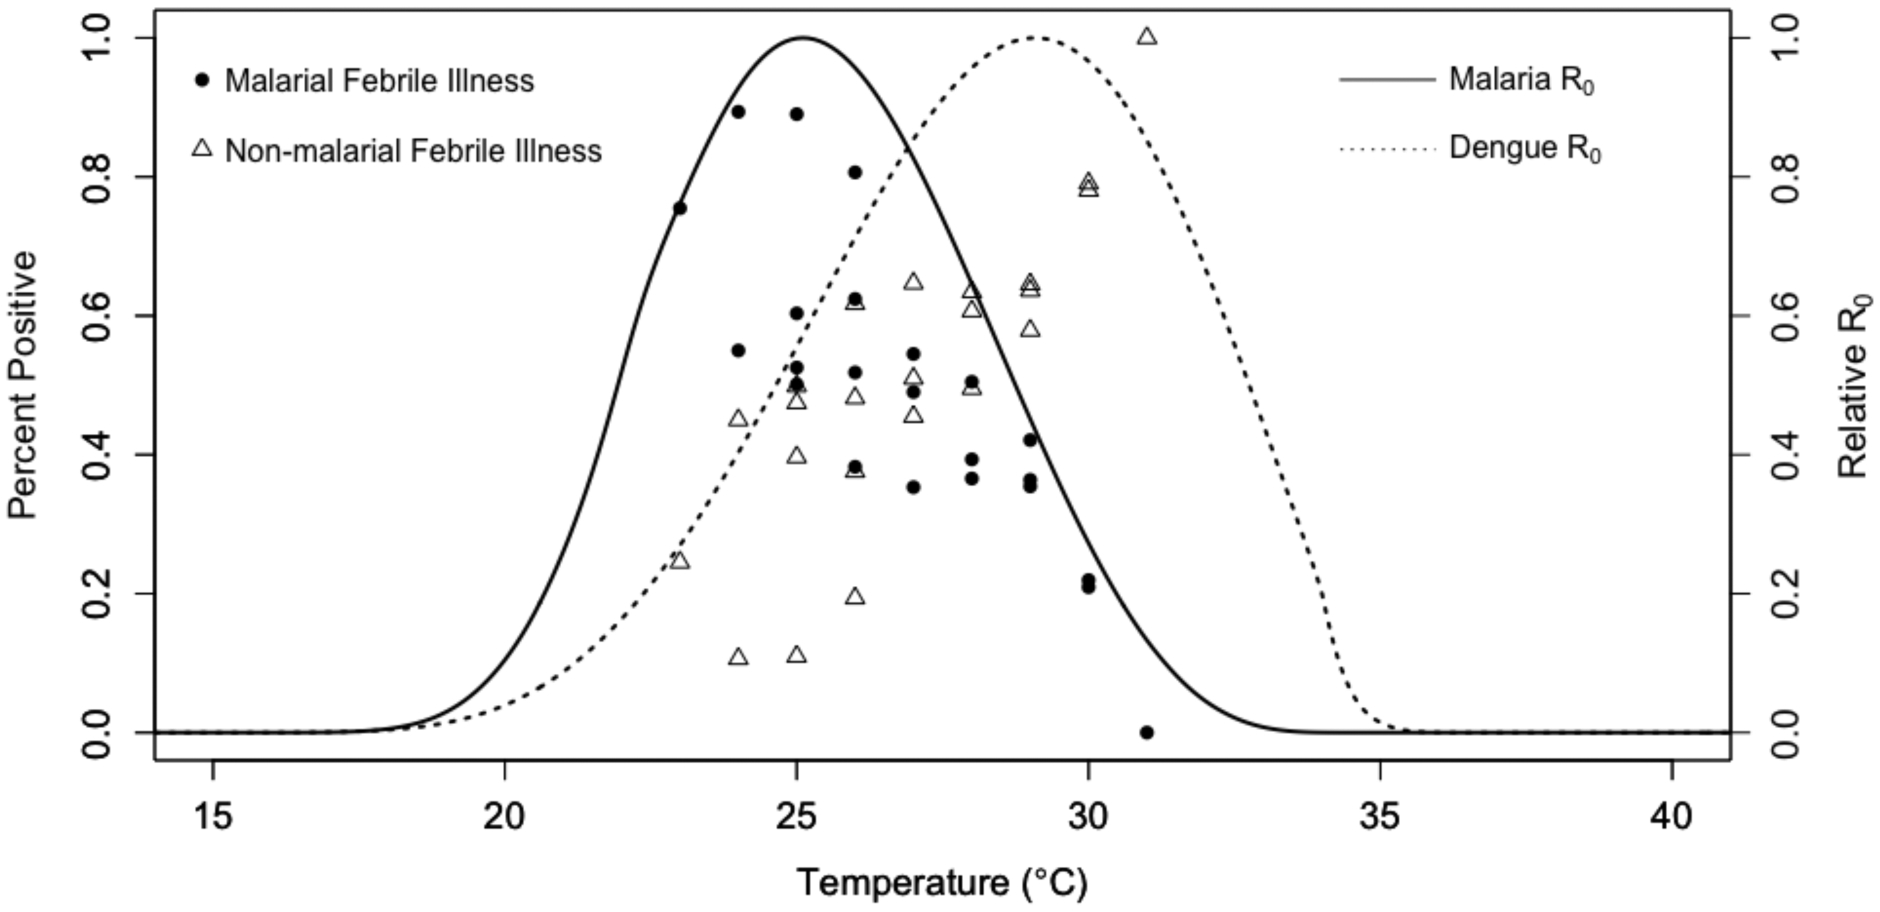
Figure 1. Malarial and non-malarial fever among Kenyan children from 2014–2018 versus temperature, overlaid on basic reproduction number curves for malaria and dengue.

Points represent proportion of children with positive malaria smears (filled circles) and proportion of children with non-malarial fever (open triangles) over temperature. Land surface temperatures at each participant visit were calculated as 30-day mean temperatures lagged by one month (the time window in which we expect temperature to affect transmission), specific to each of the four clinic sites. Proportions were calculated at 1°C intervals of temperature (x-axis) at each of the four different outpatient clinic sites in western and coastal Kenya where children with undifferentiated fever were recruited, for up to four points per temperature bin (12,33–36). Lines represent predicted basic reproduction number (R0, rescaled to range from zero to one) for malaria (solid line) and dengue (dashed line) as a function of temperature from ecological models based on laboratory mosquito and parasite data (15–17). For methods detail, see Supplementary Materials, pages 2–3.
