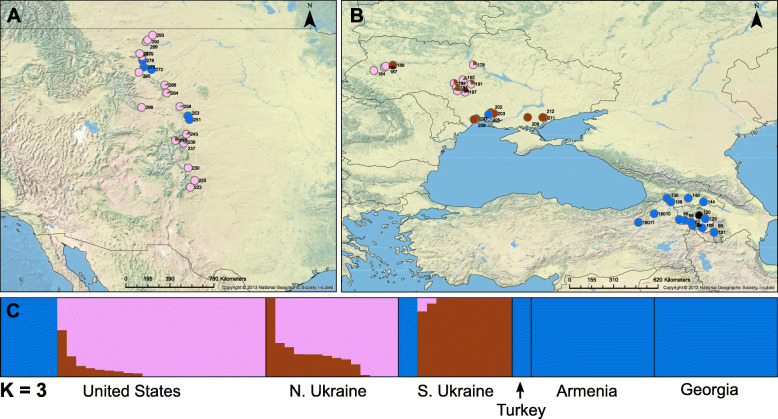
Fig. 2.
Accessions of C. microcarpa for which seed oil composition was analyzed are mapped as a collections along the Eastern Rocky Mountain range of the U.S. and b collections from the Caucasus and Ukraine. Colored circles represent the population structure for individuals, blue = Caucasus population, pink = northern Ukraine population, brown = southern Ukraine population, black = not genotyped/insufficient data. c Population structure results from ADMIXTURE analysis at K = 3 subdivided into country of origin, including 27 additional samples for which oil was not measured. Map was created under liscense using ArcGIS® software by Esri. Basemap is a source of the National Geographic Society and Esri (2019)

