Fig. 2.
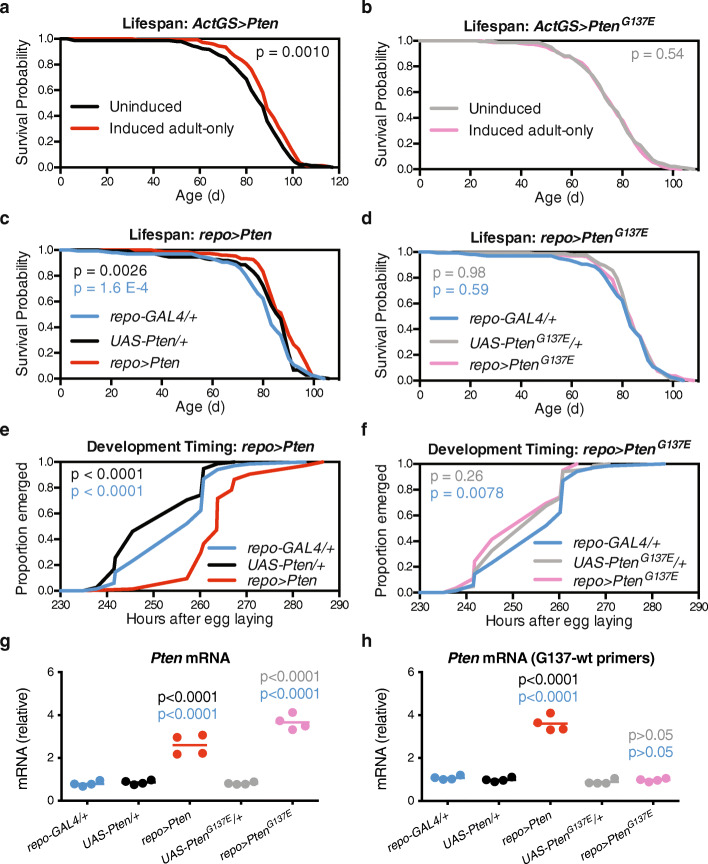
Over-expression of wild-type Pten, but not lipid phosphatase dead Pten, extends lifespan and delays development. a, b Survival curves show a extended lifespan for wDah;Actin-GeneSwitch/UAS-Pten;+ flies and b unchanged lifespan for wDah;Actin-GeneSwitch/UAS-Pten-G137E;+ flies reared on food containing 200 μM RU-486 (induced, red and pink curves) from 2 days of age compared to sibling flies reared on vehicle control food (uninduced, black and grey curves). c, d Survival curves show c extended lifespan for wDah;UAS-Pten/+;repo-GAL4/+ flies (red) compared to control wDah;+;repo-GAL4/+ (blue) and wDah;UAS-Pten/+;+ (black) flies, and d unchanged lifespan for wDah;UAS-Pten-G137E/+;repo-GAL4+ flies (pink) compared to control wDah;+;repo-GAL4/+ (blue) and wDah;UAS-Pten-G137E/+;+ (grey) flies. For all lifespans, n > 130 deaths counted per group. e, f Egg-to-adult timing shows e delayed development for wDah;UAS-Pten/+;repo-GAL4/+ flies (red) compared to control wDah;+;repo-GAL4/+ (blue) and wDah;UAS-Pten/+;+ (black) flies, and f no delay in development for wDah;UAS-Pten-G137E/+;repo-GAL4/+ flies (pink) compared to control wDah;+;repo-GAL4/+ (blue) and wDah;UAS-Pten-G137E/+;+ (grey) flies. n > 55 flies per group. Note that the repo-GAL4/+ curves in c, d and e, f are identical, as these experiments were run in parallel. g, h qPCR from head RNA shows g over-expression of Pten in both wDah;UAS-Pten/+;repo-GAL4/+ and wDah;UAS-Pten-G137E/+;repo-GAL4/+ flies using primers outside of the G137 region and h over-expression of wild-type Pten in only wDah;UAS-Pten/+;repo-GAL4/+ flies using primers designed to amplify the wild-type sequence for G137. n = 4 replicates of 10–12 heads per replicate. p values are from log-rank tests (a–f) or Bonferroni’s multiple comparison (g, h) tests versus control group of that colour

