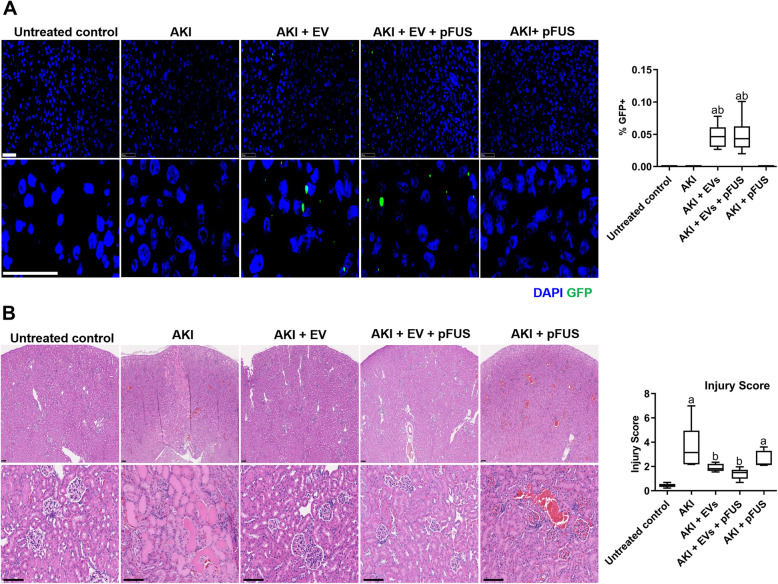
Fig. 2.
EV homing and kidney histology. a Homing of GFP-labeled EVs to the kidney, as measured by immunofluorescence (left) and flow cytometry in homogenized kidney samples (right). Scale bar represents 50 μm. b Hematoxylin and eosin staining of kidney sections, showing various levels of injury and cast formation (left), and quantification of injury score (right). Scale bar represents 100 μm. Each group has n = 6 mice. Significant difference ap < 0.05: relative to untreated control; bp < 0.05: relative to AKI; cp < 0.05: relative to AKI-EV; dp < 0.05: relative to AKI-EV-pFUS

