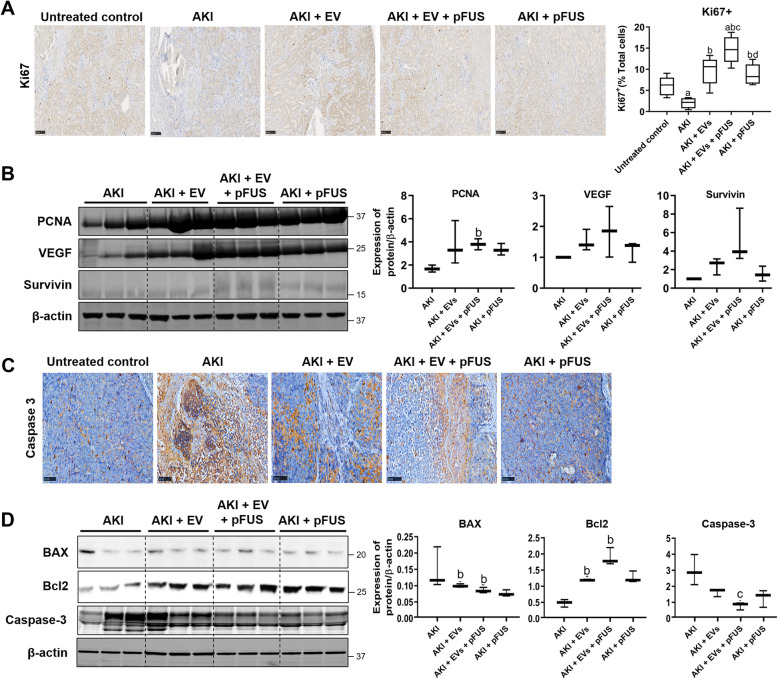
Fig. 5.
Proliferation and apoptosis. a Immunohistochemical staining for proliferation marker Ki67 in kidney tissue (left), alongside quantification of the percentage of Ki67-positive cells (right). b Western blot on kidney tissue measuring proliferation markers PCNA, VEGF, survivin, and β-actin (left) alongside quantification (right). c Immunohistochemical staining for apoptosis marker Caspase-3 in kidney tissue. d Western blot on kidney tissue measuring apoptosis markers BAX, Bcl-2, and Caspase-3 (left) alongside quantification (right). Each group has n = 3 mice. Significant difference ap < 0.05: relative to untreated control; bp < 0.05: relative to AKI; cp < 0.05: relative to AKI-EV; dp < 0.05: relative to AKI-EV-pFUS

