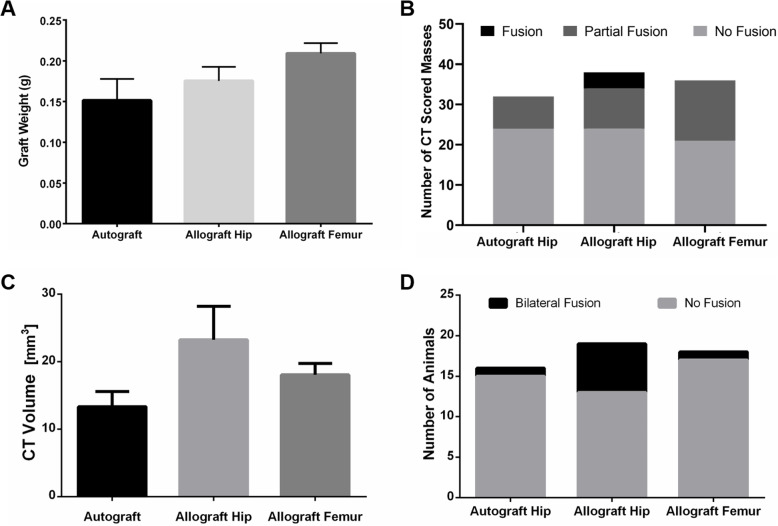
Fig. 1.
Fusion assessment. Comparisons of a pre-implantation graft weight, b number of CT fusion scored masses, c CT volumes of fusion masses, and d number of fused animals via manual palpation. CT fusion was scored as either fused if robust fusion between L4-5 was observed, partially fused if some narrowing of fusion mass between L4-5 was present, and non-fused if there was a significant discontinuity of the fusion mass. CT volumes of fusion masses were calculated using the Volumest plug-in for Image J. Animals were scored via manual palpation as bilaterally fused (little to no motion across the operated joint) or non-fused (no reduced motion across the operated joint compared to the next upper level). Data presented as mean ± SEM. For graft weight: iliac crest autograft (n = 12), syngeneic allograft hip (n = 14), and syngeneic allograft femur (n = 14). For all other assessments: iliac crest autograft (n = 16), syngeneic allograft hip (n = 19), and syngeneic allograft femur (n = 18)

