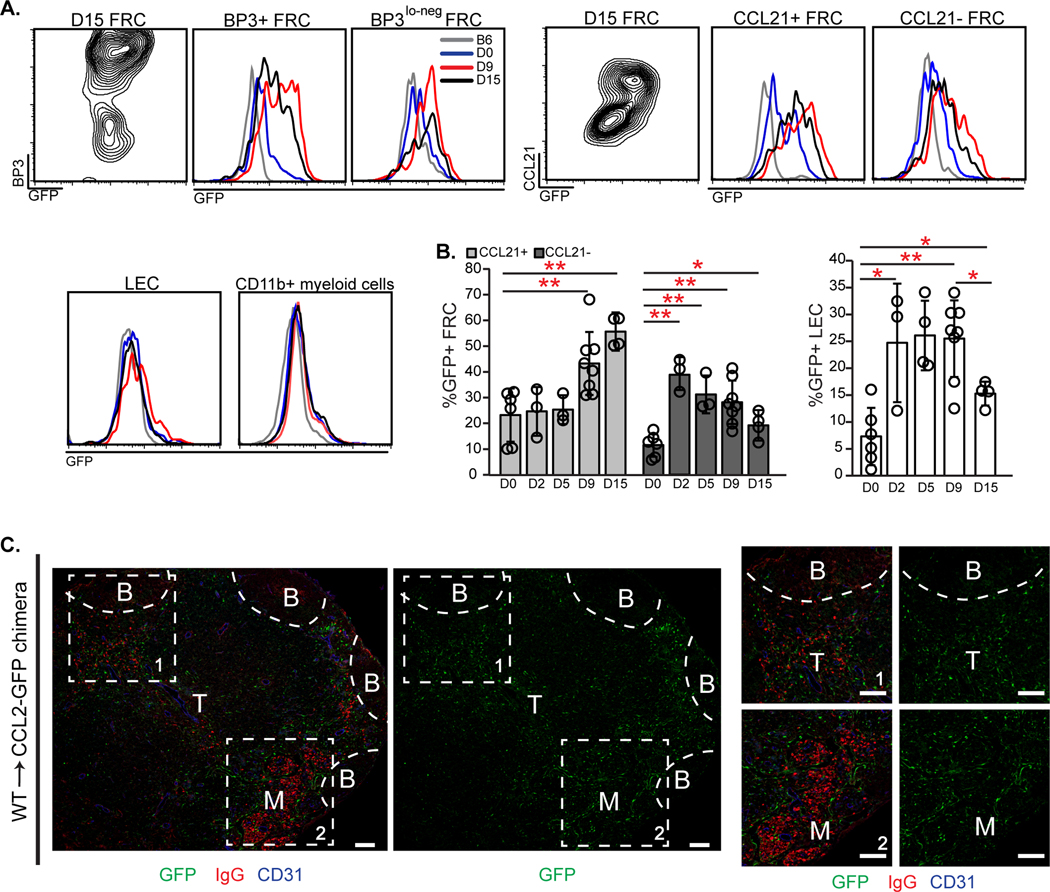
Fig. 2. Stromal CCL2 is upregulated upon immunization and co-localizes with AFCs.
(A-C) CCL2-GFP mice or WT→CCL2-GFP chimeras were immunized in footpads with OVA-Alum on day 0 (D0), and popliteal nodes harvested on indicated days. (A) Contour plots and histograms show GFP levels in the indicated cells. Fluorescence scale is log10. (B) Percentage of FRCs and LECs that are GFP+ over time. Each symbol represents one mouse; n=3–8/condition over 5 experiments. *P < 0.05, **P < 0.01 using 2-tailed unpaired Student’s t test. Error bars represent SD. (C) GFP and AFC localization. Sections from day 15 WT→CCL2-GFP chimeras were stained for GFP, mouse IgG, and CD31. (B) B cell follicles, (T) T cell zone, (M) medulla. Representative of n≥3 mice. Scale bars=100 μm.

