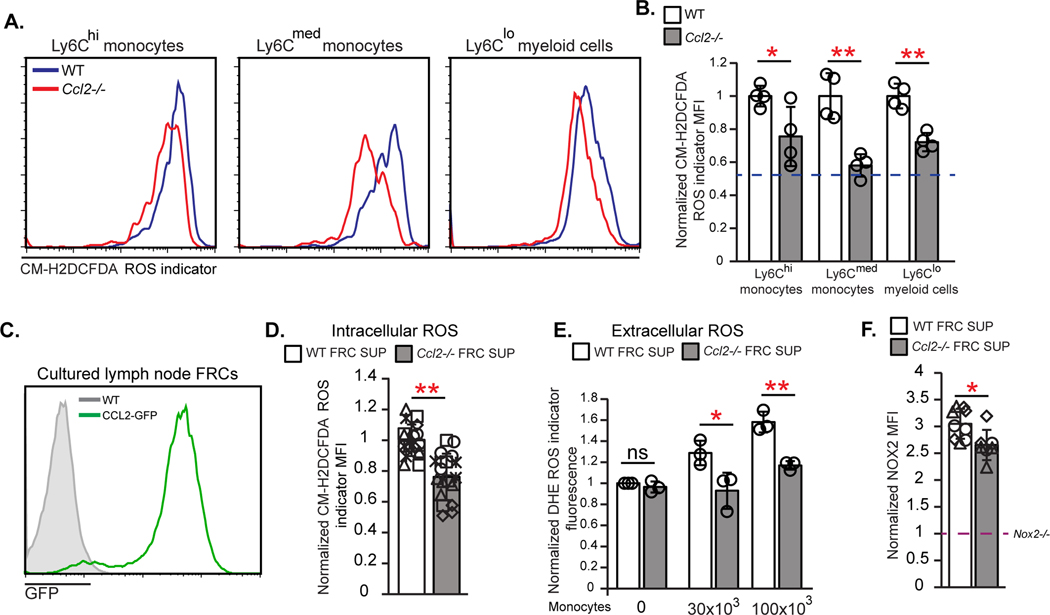
Fig. 7. FRC CCL2 regulates monocyte ROS production.
(A,B) Day 15 OVA-Alum immunized WT or Ccl2−/− lymph node cells were loaded with CM-H2DCFDA. (A) Fluorescence in indicated cells. (B) Relative ROS levels as indicated by MFI of each Ccl2−/− population normalized to MFI in WT cells. Data are from 2 experiments. Dashed line represents fluorescence of WT B cells relative to that of WT Ly6Chi monocytes. (C) GFP expression by FRCs cultured from WT and CCL2-GFP mice. (D-F) Monocytes were incubated with WT or Ccl2−/− FRC supernatants and then cells and supernatants were assayed as indicated. (D) Relative intracellular ROS in monocytes, as indicated by MFI after CM-H2DCFDA-loading. (E) Extracellular ROS in supernatants, as indicated by fluorescence of the superoxide indicator dihydroethidium (DHE) in each supernatant normalized to the value of the WT supernatant without monocytes. (F) Normalized MFI of anti-NOX2 staining in monocytes. Dashed line represents the level of NOX2 antibody staining in Nox2−/− sorted monocytes which was used as a negative control and to which the other MFIs were normalized to. (A,C) Fluorescence scale is log10. (D-F) Data are from 5 (D) and 3 (E,F) independent experiments. (D,F) each symbol is an individual well with different symbols denoting independent experiments; (E) each symbol represents the average of 2–3 wells from an experiment. *P < 0.05, **P < 0.01 by 2-tailed unpaired Student’s t test. Error bars represent standard deviation. .

