Fig. 2.
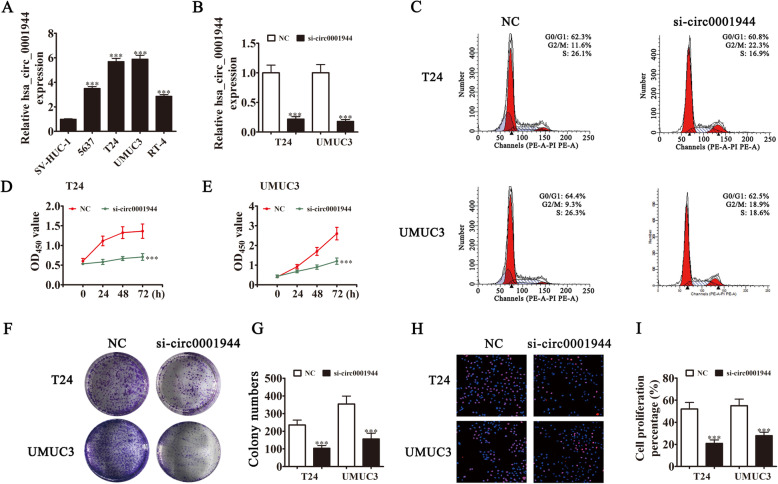
Downregulation of hsa_circ_0001944 suppressed BC proliferation in vitro. a RT-qPCR detection showing the expression of hsa_circ_0001944 in different BC cell lines. Data are presented as mean ± SD; ***P < 0.001 vs. the SV-HUC-1 group. b RT-qPCR detection showing the expression of hsa_circ_0001944 in both T24 and UMUC3 cells after transfection with siRNA against hsa_circ_0001944 or negative control. Data are presented as mean ± SD; ***P < 0.001 vs. the NC. c Flow cytometry detection showing the percentages of cells in G1, S, or G2 phase in both T24 (C) and UMUC3 (D) cells. d and e CCK8 assays were used to evaluate cell proliferation. Data are presented as mean ± SD; ***P < 0.001 vs. NC. f and g Colony formation assay showing proliferation in both T24 and UMUC3 cells. Data are presented as mean ± SD; ***P < 0.001 vs. NC. h and i Edu assays were used to evaluate cell proliferation. Data are presented as mean ± SD; ***P < 0.001 vs. NC

